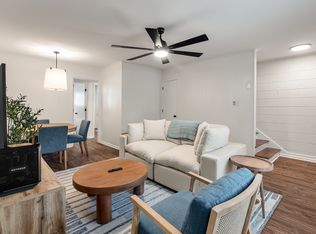
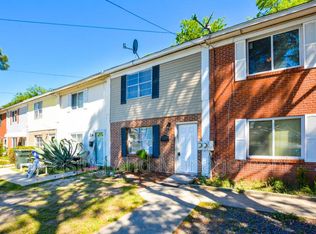
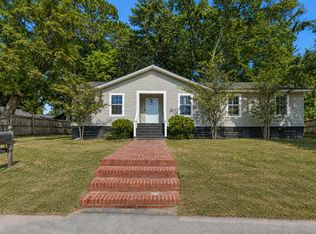
Priced UNDER appraisal, 12 Grove St is ready for its new homeowners! Centrally located downtown Charleston with easy access to Mt Pleasant or West Ashley, this modernly updated townhome (with no HOA!) is an end unit just waiting for you. Whether you're a first time buyer, an investor or looking to get onto the peninsula, this is one not to miss. Four bedrooms, two bathrooms, a fenced-in yard and more storage than you can imagine! 12 Grove St is the perfect place to call home.
Active
Price cut: $6K (6/22)
$499,000
12 Grove St, Charleston, SC 29403
3beds
1,188sqft
Townhouse
Built in 1972
2,613 Square Feet Lot
$499,700 Zestimate®
$420/sqft
$-- HOA
What's special
Fenced-in yardModernly updated townhomeFour bedroomsTwo bathrooms
- 58 days |
- 662 |
- 33 |
Zillow last checked:
Listing updated:
Listed by:
The Pulse Charleston
Source: CTMLS,MLS#: 26012325
Loading...
Facts & features
Interior
Bedrooms & bathrooms
- Bedrooms: 3
- Bathrooms: 2
- Full bathrooms: 2
Rooms
- Room types: Living/Dining Combo, Eat-In-Kitchen
Heating
- Electric
Cooling
- Central Air
Features
- Ceiling - Smooth, Eat-in Kitchen
- Has fireplace: No
Interior area
- Total structure area: 1,188
- Total interior livable area: 1,188 sqft
Property
Parking
- Parking features: Off Street
Features
- Levels: Two
- Stories: 2
- Entry location: Ground Level
- Fencing: Privacy,Wood
Lot
- Size: 2,613 Square Feet
- Features: 0 - .5 Acre, Cul-De-Sac
Details
- Additional structures: Shed(s)
- Parcel number: 4631203147
Construction
Type & style
- Home type: Townhouse
- Property subtype: Townhouse
- Attached to another structure: Yes
Materials
- Block, Brick Veneer
- Foundation: Slab
- Roof: Asphalt
Condition
- New construction: No
- Year built: 1972
Utilities & green energy
- Sewer: Public Sewer
- Water: Public
Community & HOA
Community
- Subdivision: Romney Village
Location
- Region: Charleston
Financial & listing details
- Price per square foot: $420/sqft
- Tax assessed value: $278,500
- Annual tax amount: $2,031
- Date on market: 4/30/2026
- Listing terms: Any,Cash
Estimated market value
$499,700
$475,000 - $525,000
$3,413/mo
Price history
| Date | Event | Price |
|---|---|---|
| 6/22/2026 | Price change | $499,000-1.2%$420/sqft |
Source: | ||
| 6/16/2026 | Price change | $505,000-1.9%$425/sqft |
Source: | ||
| 6/2/2026 | Price change | $515,000-0.9%$434/sqft |
Source: | ||
| 5/25/2026 | Price change | $519,500-0.8%$437/sqft |
Source: | ||
| 5/18/2026 | Price change | $523,500-0.3%$441/sqft |
Source: | ||
| 5/11/2026 | Price change | $525,000-0.9%$442/sqft |
Source: | ||
| 4/30/2026 | Price change | $530,000-1.5%$446/sqft |
Source: | ||
| 4/28/2026 | Listing removed | $3,250$3/sqft |
Source: Zillow Rentals Report a problem | ||
| 3/23/2026 | Price change | $538,000-0.7%$453/sqft |
Source: | ||
| 3/4/2026 | Price change | $542,000-1%$456/sqft |
Source: | ||
| 1/21/2026 | Price change | $547,500-0.5%$461/sqft |
Source: | ||
| 12/24/2025 | Listed for rent | $3,250+14%$3/sqft |
Source: Zillow Rentals Report a problem | ||
| 12/15/2025 | Listed for sale | $550,000+74.6%$463/sqft |
Source: | ||
| 12/15/2025 | Listing removed | $2,850$2/sqft |
Source: Zillow Rentals Report a problem | ||
| 11/15/2025 | Price change | $2,850-3.4%$2/sqft |
Source: Zillow Rentals Report a problem | ||
| 10/4/2025 | Price change | $2,950-9.2%$2/sqft |
Source: Zillow Rentals Report a problem | ||
| 9/23/2025 | Price change | $3,250-5.8%$3/sqft |
Source: Zillow Rentals Report a problem | ||
| 9/19/2025 | Listed for rent | $3,450$3/sqft |
Source: Zillow Rentals Report a problem | ||
| 6/13/2025 | Sold | $315,000-3.7%$265/sqft |
Source: | ||
| 5/27/2025 | Listed for sale | $327,000$275/sqft |
Source: | ||
Public tax history
| Year | Property taxes | Tax assessment |
|---|---|---|
| 2025 | $2,031 +457.4% | $6,460 +271.3% |
| 2024 | $364 +2.3% | $1,740 |
| 2023 | $356 +17.7% | $1,740 |
| 2022 | $302 -3.4% | $1,740 |
| 2021 | $313 -2.6% | $1,740 |
| 2020 | $321 | $1,740 +38.1% |
| 2019 | $321 | $1,260 -61.3% |
| 2017 | $321 +25% | $3,260 |
| 2016 | $257 +2.8% | $3,260 |
| 2015 | $250 -2.1% | $3,260 |
| 2014 | $255 | -- |
| 2011 | $255 +27% | -- |
| 2010 | $201 -11.1% | $3,010 |
| 2009 | $226 +4.7% | $3,010 |
| 2008 | $216 +3.9% | $3,010 |
| 2006 | $208 -0.7% | $3,010 |
| 2005 | $209 +135.2% | $3,010 +56% |
| 2004 | $89 | $1,930 |
| 2003 | $89 -76.2% | $1,930 |
| 2002 | $374 -15.6% | $1,930 -6.3% |
| 2000 | $443 | $2,060 |
Find assessor info on the county website
Monthly payment
Est. payment$--/mo
Payment breakdown
Explore the cost of this home by adjusting the details. Changes won't be saved.All calculations are estimates and provided by Zillow, Inc. for informational purposes only. Actual amounts may vary.
HOA fees may include property taxes on listings classified as Co-Ops. Contact the listing agent and/or owner for fee details.
Mortgage interest rates are dependent on a number of factors, including credit score, down payment, and repayment length. Interest rate data provided by Zillow Group Marketplace, Inc. as of 1/1/1970 from various mortgage lenders with which we have lead or other similar arrangements; the Estimated Payment is an average of those rates.
See how much you could borrow to make a competitive offer.
Climate risks
Neighborhood: North Central
Nearby schools
GreatSchools rating
- 7/10James Simons Elementary SchoolGrades: PK-8Distance: 0.3 mi
- 1/10Burke High SchoolGrades: 9-12Distance: 0.9 mi
- 2/10Mitchell Elementary SchoolGrades: PK-5Distance: 0.7 mi
Schools provided by the listing agent
- Elementary: James Simons
- Middle: Simmons Pinckney
- High: Burke
Source: CTMLS. This data may not be complete. We recommend contacting the local school district to confirm school assignments for this home.
A local agent can set up tours, give advice and negotiate with sellers.


Nearby cities
Nearby neighborhoods
Nearby zip codes
Other Charleston Topics
