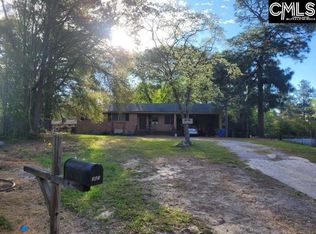
Investor special with strong upside potential in Eastover. This property sits on a large lot and offers a great opportunity for a fix and flip, rental, or owner occupant renovation project. Home needs repairs and updates throughout and is being sold strictly as-is. Spacious layout with plenty of room to reimagine the property and add value. Convenient access to Columbia, Shaw AFB, and nearby highways.
Active
Price cut: $5K (7/25)
$77,000
126 John Ammons Rd, Eastover, SC 29044
3beds
1,144sqft
:
Get pre-qualified$513/mo
Single Family Residence
Built in 1992
1 Acres Lot
$-- Zestimate®
$67/sqft
$-- HOA
What's special
Large lotSpacious layout
- 49 days |
- 363 |
- 26 |
Zillow last checked:
Listing updated:
Listed by:
Transit Realty, LLC
Source: CTMLS,MLS#: 26013772
Facts & features
Interior
Bedrooms & bathrooms
- Bedrooms: 3
- Bathrooms: 2
- Full bathrooms: 2
Features
- Has fireplace: No
Interior area
- Total structure area: 1,144
- Total interior livable area: 1,144 sqft
Property
Features
- Stories: 1
Lot
- Size: 1 Acres
- Features: .5 - 1 Acre
Details
- Parcel number: 352000950
Construction
Type & style
- Home type: SingleFamily
- Architectural style: Traditional
- Property subtype: Single Family Residence
Materials
- Roof: Asphalt
Condition
- New construction: No
- Year built: 1992
Utilities & green energy
- Sewer: Septic Tank
- Water: Well
Community & HOA
Community
- Subdivision: None
Location
- Region: Eastover
Financial & listing details
- Price per square foot: $67/sqft
- Tax assessed value: $3,000
- Date on market: 6/10/2026
- Listing terms: Cash,Conventional
Estimated market value
Not available
Estimated sales range
Not available
$1,306/mo
Price history
| Date | Event | Price |
|---|---|---|
| 7/25/2026 | Price change | $77,000-6.1%$67/sqft |
Source: | ||
| 6/29/2026 | Pending sale | $82,000$72/sqft |
Source: | ||
| 6/10/2026 | Listed for sale | $82,000-21.3%$72/sqft |
Source: | ||
| 4/1/2026 | Sold | $104,222-25.6%$91/sqft |
Source: Public Record Report a problem | ||
| 1/31/2023 | Sold | $140,000+12.4%$122/sqft |
Source: Public Record Report a problem | ||
| 12/12/2022 | Listed for sale | $124,500+66%$109/sqft |
Source: | ||
| 8/14/2017 | Sold | $75,000-6.3%$66/sqft |
Source: Public Record Report a problem | ||
| 6/13/2017 | Pending sale | $80,000$70/sqft |
Source: SC Homes & Land Realty, LLC #419061 Report a problem | ||
| 4/18/2017 | Price change | $80,000-5.9%$70/sqft |
Source: SC Homes & Land Realty, LLC #419061 Report a problem | ||
| 3/6/2017 | Listed for sale | $85,000+304.8%$74/sqft |
Source: SC Homes & Land Realty, LLC #419061 Report a problem | ||
| 2/5/2015 | Sold | $21,000-11.6%$18/sqft |
Source: | ||
| 1/22/2015 | Pending sale | $23,750$21/sqft |
Source: PERSONAL TOUCH REALTY #121934 Report a problem | ||
| 1/12/2015 | Price change | $23,750-17.4%$21/sqft |
Source: PERSONAL TOUCH REALTY #121934 Report a problem | ||
| 11/12/2014 | Listed for sale | $28,750-67.3%$25/sqft |
Source: PERSONAL TOUCH REALTY #121934 Report a problem | ||
| 12/14/2007 | Sold | $88,000$77/sqft |
Source: Public Record Report a problem | ||
Public tax history
| Year | Property taxes | Tax assessment |
|---|---|---|
| 2022 | -- | $3,000 |
| 2021 | $832 -1.3% | $3,000 |
| 2020 | $843 +3.7% | $3,000 |
| 2019 | $813 +3.1% | $3,000 |
| 2018 | $788 | $3,000 +18.6% |
| 2017 | $788 +14.1% | $2,530 -33.2% |
| 2016 | $691 -63.7% | $3,790 |
| 2015 | $1,902 +1.3% | $3,790 -94% |
| 2014 | $1,877 +185.6% | $63,200 +2398% |
| 2013 | $657 | $2,530 -28.1% |
| 2012 | -- | $3,520 |
| 2011 | -- | $3,520 |
| 2010 | -- | $3,520 |
| 2009 | -- | $3,520 |
| 2008 | -- | $3,520 +16.6% |
| 2007 | -- | $3,020 |
| 2006 | -- | $3,020 |
| 2005 | -- | $3,020 +18.9% |
| 2004 | -- | $2,540 |
| 2003 | -- | $2,540 |
| 2002 | -- | $2,540 |
| 2000 | -- | $2,540 |
Find assessor info on the county website
Monthly payment
Est. payment
Payment breakdown
Explore the cost of this home by adjusting the details. Changes won't be saved.Climate risks
Neighborhood: 29044
Nearby schools
GreatSchools rating
- 6/10Webber SchoolGrades: PK-5Distance: 4.5 mi
- 2/10Southeast Middle SchoolGrades: 6-8Distance: 7.1 mi
- 2/10Lower Richland High SchoolGrades: 9-12Distance: 8.8 mi
Schools provided by the listing agent
- Middle: Hopkins Middle
- High: Lower Richland
Source: CTMLS. This data may not be complete. We recommend contacting the local school district to confirm school assignments for this home.
- $2,4704 bd2 ba1.1k sqft128 John Ammons Rd, Eastover, SC 29044Off Market
- $17,2003 bd2 ba2.9k sqft11451 Garners Ferry Rd, Eastover, SC 29044Off Market
- $223,8004 bd2 ba1.8k sqft136 John Ammons Rd, Eastover, SC 29044Off Market
- $83,7003 bd2 ba1.2k sqft11447 Garners Ferry Rd, Eastover, SC 29044Off Market
- $7,200-- bd-- ba-- sqft903 Pond Dr, Eastover, SC 29044Off Market
- $158,0004 bd2 ba1.8k sqft148 John Ammons Rd, Eastover, SC 29044Off Market
- $43,7003 bd3 ba1.4k sqft904 Pond Dr, Eastover, SC 29044Off Market
- $6,0004 bd2 ba7k sqft11380 Garners Ferry Rd, Eastover, SC 29044Sold
A local agent can set up tours, give advice and negotiate with sellers.
A local lender can help you make sure your offer is ready when you are.
Similar homes
- $70,0003 bd2 ba1.1k sqft365 Garden Dr, Columbia, SC 29204For Sale
 MLS ID #633156, Steve Cowart. Consolidated MLS
 - $85,0003 bd2 ba1.2k sqft600 Ermine Rd Lot 553, West Columbia, SC 29170For Sale
 MLS ID #2613677, Brittany Grace, South Strand Group, LLC. CCAR
 - $105,0003 bd2 ba1.1k sqft1802 Ardmore Rd, Columbia, SC 29223For Sale
 MLS ID #638241, Chip Jefferson. Consolidated MLS
 - $77,9004 bd2 ba1k sqftSpears Creek MHC, Elgin, SC 29045For Sale
 MLS ID #594912, Monica Pineda. MHBO
 - $110,0003 bd1 ba1.3k sqft2360 Lisbon Dr, Sumter, SC 29154For SaleMLS ID #617388, Larrie McKnight. Consolidated MLS
- $89,0003 bd1 ba1k sqft521 Briercliff Dr, Columbia, SC 29203For Sale By Owner
- $60,0003 bd2 ba960 sqft70 Chanson Ct, Sumter, SC 29154For SaleMLS ID #11740001, Morisa Herrick, Palmetto Woods. My State MLS
- $79,9002 bd1 ba1.2k sqft4600 Fort Jackson Blvd APT 106, Columbia, SC 29209For SaleMLS ID #634290, Darryl Robinson. Consolidated MLS
- $69,0002 bd2 ba1.2k sqft3630 Ranch Road 16 #8, Columbia, SC 29206For SaleMLS ID #634719, Mo Holler. Consolidated MLS
- $109,9003 bd2 ba1.2k sqft3506 Carver St, Columbia, SC 29203For SaleMLS ID #638054, Trey Brave. Consolidated MLS
- $42,0003 bd1 ba980 sqft2100 Legrand Rd. Lot 4, Columbia, SC 29223For SaleMLS ID #2601791, Brittany Grace, South Strand Group, LLC. CCAR
- $94,9002 bd2 ba1k sqft1825 Saint Julian Pl APT 11I, Columbia, SC 29204For SaleMLS ID #639289, Natalie Robinson. Consolidated MLS
- $77,9003 bd2 ba1k sqftSpears Creek MHC, Elgin, SC 29045For SaleMLS ID #551217, Monica Pineda. MHBO
- $100,0003 bd3 ba1.7k sqft152 Lionsgate Dr, Columbia, SC 29223For SaleMLS ID #637415, Rachel F Thompson. Consolidated MLS
- $60,9002 bd1 ba1.1k sqft1218 Walcott St, Columbia, SC 29201For SaleMLS ID #557042, Cynthia J Smith. Consolidated MLS
- $95,0002 bd2 ba960 sqft207 Weddell St APT 1H, Columbia, SC 29223For SaleMLS ID #617924, Wade Cooke. Consolidated MLS
- $110,0002 bd2 ba1.1k sqft6530 Davidson St #5E, Columbia, SC 29209For SaleMLS ID #635604, Theresa Reese. Consolidated MLS
- $110,0002 bd2 ba1.2k sqft3630 Ranch Road 5 #2, Columbia, SC 29206For SaleMLS ID #613569, Evon Wages. Consolidated MLS
- $110,5002 bd3 ba1.2k sqft108 Lionsgate Dr, Columbia, SC 29223For SaleMLS ID #634457, Earl Ware. Consolidated MLS
- $109,0002 bd1 ba1.1k sqft4600 Fort Jackson Blvd APT 235, Columbia, SC 29209For SaleMLS ID #635236, Robert Crawford. Consolidated MLS
