This 1088 square foot single family home has 3 bedrooms and 2.0 bathrooms. This home is located at 1273 Roxbury Dr, San Bernardino, CA 92404.
Pre-foreclosure
Est. $482,700
1273 Roxbury Dr, San Bernardino, CA 92404
3beds
1,088sqft
SingleFamily
Built in 1948
6,599 Square Feet Lot
$482,700 Zestimate®
$444/sqft
$-- HOA
Overview
- 113 days
- 6
- 0
Facts & features
Interior
Bedrooms & bathrooms
- Bedrooms: 3
- Bathrooms: 2
- Full bathrooms: 2
Heating
- Wall, Gas
Cooling
- None
Appliances
- Included: Dishwasher, Garbage disposal, Microwave, Range / Oven, Refrigerator
- Laundry: Inside, Area, Gas Dryer Hookup, Washer Hookup
Features
- Flooring: Tile, Carpet, Laminate
- Basement: None
- Has fireplace: No
- Common walls with other units/homes: No Common Walls
Interior area
- Total interior livable area: 1,088 sqft
Property
Parking
- Total spaces: 3
- Parking features: Garage - Detached
Features
- Levels: One
- Exterior features: Stucco
- Has view: Yes
- View description: Mountain
Lot
- Size: 6,599 Square Feet
- Features: 0-1 Unit/Acre
Details
- Parcel number: 0147143110000
- Special conditions: Standard
Construction
Type & style
- Home type: SingleFamily
Materials
- wood frame
- Roof: Composition
Condition
- Year built: 1948
Utilities & green energy
- Sewer: Public Sewer
- Water: Public
Community & HOA
Location
- Region: San Bernardino
Financial & listing details
- Price per square foot: $444/sqft
- Tax assessed value: $482,849
Foreclosure details
Estimated market value
$482,700
$459,000 - $507,000
$2,626/mo
Price history
| Date | Event | Price |
|---|---|---|
| 7/13/2022 | Sold | $455,000+11.6%$418/sqft |
Source: Public Record Report a problem | ||
| 5/6/2022 | Pending sale | $407,700$375/sqft |
Source:  CRMLS #CV22088145 Report a problem | ||
| 4/29/2022 | Listed for sale | $407,700+63.1%$375/sqft |
Source: CRMLS #CV22088145 Report a problem | ||
| 1/30/2019 | Sold | $250,000-3.1%$230/sqft |
Source: Public Record Report a problem | ||
| 12/31/2018 | Pending sale | $258,000$237/sqft |
Source: HOME LIBERTY #IV18260452 Report a problem | ||
| 11/30/2018 | Listed for sale | $258,000$237/sqft |
Source: HOME LIBERTY #IV18260452 Report a problem | ||
| 11/21/2018 | Pending sale | $258,000$237/sqft |
Source: HOME LIBERTY #IV18260452 Report a problem | ||
| 11/9/2018 | Price change | $258,000-0.8%$237/sqft |
Source: HOME LIBERTY #IV18260452 Report a problem | ||
| 10/27/2018 | Listed for sale | $260,000+108%$239/sqft |
Source: HOME LIBERTY #IV18260452 Report a problem | ||
| 1/5/2018 | Sold | $125,000+31.6%$115/sqft |
Source: Public Record Report a problem | ||
| 8/29/2001 | Sold | $95,000+137.5%$87/sqft |
Source: Public Record Report a problem | ||
| 1/31/1995 | Sold | $40,000$37/sqft |
Source: Public Record Report a problem | ||
Public tax history
| Year | Property taxes | Tax assessment |
|---|---|---|
| 2026 | -- | $482,849 +2% |
| 2025 | $6,065 +2.1% | $473,382 +2% |
| 2024 | $5,940 +2.6% | $464,100 +2% |
| 2023 | $5,792 +65.9% | $455,000 +73.1% |
| 2022 | $3,491 -0.2% | $262,795 +2% |
| 2021 | $3,497 -0.3% | $257,642 +1% |
| 2020 | $3,506 +45.5% | $255,000 +47.1% |
| 2019 | $2,410 +35.9% | $173,400 +40.6% |
| 2018 | $1,774 +3.2% | $123,344 +2% |
| 2017 | $1,719 | $120,925 +2% |
| 2016 | $1,719 +3.1% | $118,554 +1.5% |
| 2015 | $1,668 +7.7% | $116,773 +2% |
| 2014 | $1,548 | $114,485 +20.5% |
| 2013 | -- | $95,000 +12.6% |
| 2012 | -- | $84,400 |
| 2011 | -- | $84,400 |
| 2010 | -- | $84,400 -3% |
| 2009 | -- | $87,000 -18.6% |
| 2008 | -- | $106,845 +2% |
| 2007 | -- | $104,750 +2% |
| 2006 | -- | $102,697 +2% |
| 2005 | -- | $100,684 +2% |
| 2004 | -- | $98,709 +1.9% |
| 2003 | -- | $96,900 +2% |
| 2002 | -- | $95,000 +113.1% |
| 2001 | -- | $44,589 +2% |
| 2000 | -- | $43,715 |
Find assessor info on the county website
Monthly payment
Climate risks
Neighborhood: Perris Hills
Nearby schools
Schools provided by the listing agent
- District: San Bernardino City Unified
Source: The MLS. This data may not be complete. We recommend contacting the local school district to confirm school assignments for this home.
- $439,9003 bd1 ba1.1k sqft1287 Roxbury Dr, San Bernardino, CA 92404Off Market

- $403,4003 bd1 ba1.1k sqft1263 Roxbury Dr, San Bernardino, CA 92404Off Market
- $468,0003 bd1 ba1k sqft1295 Roxbury Dr, San Bernardino, CA 92404Off Market
- $430,0003 bd1 ba1k sqft1255 Roxbury Dr, San Bernardino, CA 92404Off Market

Similar homes
- $--3 bd1 ba1.1k sqft2765 Fremontia Dr, San Bernardino, CA 92404Auction
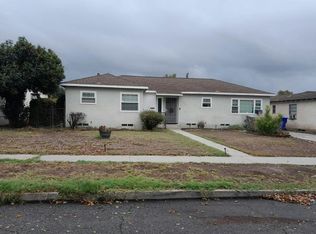 Auction.com 2
- $449,0003 bd2 ba1.4k sqft25282 Anson St, San Bernardino, CA 92404For Sale
 MLS ID #BB26228058, Michael Williams, Compass. CRMLS
- $520,0003 bd2 ba1.3k sqft2315 N Lugo Ave, San Bernardino, CA 92404For Sale
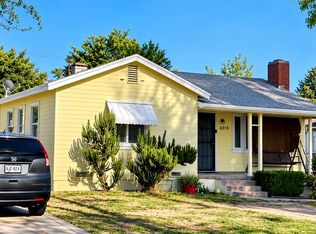 MLS ID #GD26228524, Norair Youssefian, Nick-Nick Realty. CRMLS
- $575,0004 bd3 ba1.5k sqft1440 Pepper Tree Ln, San Bernardino, CA 92404For Sale
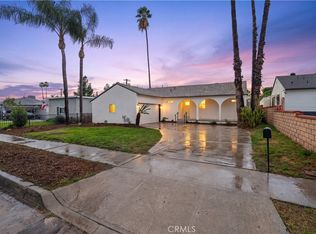 MLS ID #TR26227737, Peter Aguilar, Top Producers Realty Partners. CRMLS
