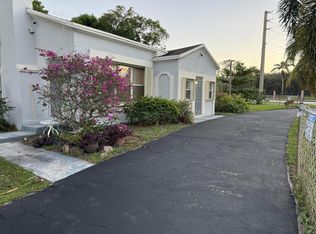
THIS A FANTASTIC INVESTMENT OPPORTUNITY FOR THOSE LOOKING INTO A LUCRATIVE MULTY-FAMILY PROPERTY IN THIS MARKET. THIS DUPLEX FEATURES 3/2 EACH UNIT AND ARE CURRENTLY TENANTS OCCUPIED. TENANTS MONTH TO MONTH. WITH ITS PRIME LOCATION CLOSE TO BEACHES AND STORES, THIS PROPERTY OFFERS BOTH CONVENIENCE AND COMFORT.
For sale
$894,900
128 SW 3rd Avenue, Delray Beach, FL 33444
6beds
4baths
2,400sqft
Duplex, Multi Family, Multi Family
Built in 1990
-- sqft lot
$841,100 Zestimate®
$373/sqft
$-- HOA
What's special
- 131 days |
- 351 |
- 16 |
Zillow last checked:
Listing updated:
Listed by:
Kuljon Pierre 561-662-8301,
Highlight Realty Corp/LW,
Paul Jacques 561-441-9695,
Xcellence
Source: BeachesMLS,MLS#: R11165334 Originating MLS: BeachesMLS
Loading...
Facts & features
Interior
Bedrooms & bathrooms
- Bedrooms: 6
- Bathrooms: 4
Heating
- Central
Cooling
- Central Air
Features
- Flooring: Ceramic Tile
Interior area
- Total structure area: 2,400
- Total interior livable area: 2,400 sqft
Property
Features
- Levels: One
- Stories: 1
- Exterior features: None
- Has view: Yes
- View description: Other
- Waterfront features: None
Lot
- Size: 6,995 Square Feet
- Features: < 1/4 Acre
Details
- Parcel number: 12434617070380130
- Zoning: RM(cit
- Special conditions: Listed As-Is
Construction
Type & style
- Home type: MultiFamily
- Property subtype: Duplex, Multi Family, Multi Family
Materials
- Block
- Roof: Composition
Condition
- Resale
- New construction: No
- Year built: 1990
Utilities & green energy
- Electric: 3 Phase
- Sewer: Public Sewer
- Water: Multiple Meters, Public
- Utilities for property: Cable Available, Sewer Available, Water Available
Community & HOA
Community
- Subdivision: DELRAY BEACH
HOA
- Has HOA: No
Location
- Region: Delray Beach
Financial & listing details
- Price per square foot: $373/sqft
- Tax assessed value: $508,463
- Annual tax amount: $8,984
- Date on market: 2/20/2026
- Cumulative days on market: 133 days
- Listing terms: Cash,Conventional
- Tenant pays: Cable TV, Electricity, Water
Estimated market value
$841,100
$799,000 - $883,000
$2,829/mo
Price history
| Date | Event | Price |
|---|---|---|
| 2/20/2026 | Listed for sale | $894,900+98.9%$373/sqft |
Source: | ||
| 5/14/2024 | Sold | $450,000-28%$188/sqft |
Source: | ||
| 11/17/2023 | Pending sale | $625,000$260/sqft |
Source: | ||
| 7/30/2023 | Price change | $625,000+19%$260/sqft |
Source: | ||
| 6/22/2023 | Pending sale | $525,000$219/sqft |
Source: | ||
| 6/15/2023 | Listed for sale | $525,000+148.8%$219/sqft |
Source: | ||
| 3/3/2017 | Sold | $211,000+101%$88/sqft |
Source: | ||
| 12/21/2011 | Sold | $105,000+18%$44/sqft |
Source: Public Record Report a problem | ||
| 12/14/1999 | Sold | $89,000$37/sqft |
Source: Public Record Report a problem | ||
Public tax history
| Year | Property taxes | Tax assessment |
|---|---|---|
| 2025 | $8,984 +22.9% | $508,463 +34.9% |
| 2024 | $7,312 +4% | $376,981 +8.5% |
| 2023 | $7,028 +15.4% | $347,402 +8.4% |
| 2022 | $6,090 +10.1% | $320,376 +8.4% |
| 2021 | $5,530 +8.3% | $295,673 +7.9% |
| 2020 | $5,106 -10.2% | $274,152 +4.5% |
| 2019 | $5,687 | $262,397 +9.6% |
| 2018 | $5,687 +11.3% | $239,403 +9.9% |
| 2017 | $5,110 +21.3% | $217,785 +102.8% |
| 2016 | $4,212 +83.8% | $107,388 +5.9% |
| 2015 | $2,292 +17.5% | $101,387 +5.8% |
| 2014 | $1,951 +9.7% | $95,861 +5.9% |
| 2013 | $1,778 +6.1% | $90,506 +5.9% |
| 2012 | $1,677 -27.9% | $85,504 -1.9% |
| 2011 | $2,324 -4.2% | $87,150 -4.5% |
| 2010 | $2,426 -11.8% | $91,236 -16.3% |
| 2009 | $2,749 -32.5% | $109,030 -41.6% |
| 2008 | $4,072 -18.1% | $186,648 -21.1% |
| 2007 | $4,972 +16.7% | $236,562 +29% |
| 2006 | $4,261 | $183,349 +16.4% |
| 2005 | -- | $157,579 +25.6% |
| 2004 | $1,866 +906.6% | $125,488 +12.8% |
| 2003 | $185 -91.9% | $111,225 -0.8% |
| 2002 | $2,283 -5.9% | $112,120 +22% |
| 2001 | $2,427 +10.9% | $91,934 +10.6% |
| 2000 | $2,189 +11.4% | $83,091 +0.3% |
| 1999 | $1,965 | $82,812 |
Find assessor info on the county website
Monthly payment
Est. payment$--/mo
Payment breakdown
Explore the cost of this home by adjusting the details. Changes won't be saved.All calculations are estimates and provided by Zillow, Inc. for informational purposes only. Actual amounts may vary.
HOA fees may include property taxes on listings classified as Co-Ops. Contact the listing agent and/or owner for fee details.
Mortgage interest rates are dependent on a number of factors, including credit score, down payment, and repayment length. Interest rate data provided by Zillow Group Marketplace, Inc. as of 1/1/1970 from various mortgage lenders with which we have lead or other similar arrangements; the Estimated Payment is an average of those rates.
See how much you could borrow to make a competitive offer.
Climate risks
Neighborhood: 33444
Nearby schools
GreatSchools rating
- 6/10Pine Grove Elementary SchoolGrades: PK-5Distance: 0.9 mi
- 3/10Carver Middle SchoolGrades: 6-8Distance: 2.3 mi
- 5/10Atlantic High SchoolGrades: 9-12Distance: 1.4 mi
A local agent can set up tours, give advice and negotiate with sellers.


- Florida
- Palm Beach County
- Delray Beach
- 33444
- 128 SW 3rd Avenue
Nearby cities
Nearby neighborhoods
Nearby zip codes
Other Delray Beach Topics
