Presenting this 3 level multifamily home ready for immediate occupancy. This two-family dwelling provides a unique opportunity for an investor or owner occupant. The property offers nine bedrooms, 3 on the first floor unit and 2 on the 2nd floor unit featuring hardwood flooring in multiple areas of the home. The property includes two full bathrooms, one half bathroom, a private front porch for the 1st floor and the convenience of a two-car garage. Schedule a showing today.
Under contract
$435,000
129-131 W Alvord St, Springfield, MA 01108
9beds
2,896sqft
Multi Family
Built in 1922
-- sqft lot
$433,200 Zestimate®
$150/sqft
$-- HOA
What's special
- 55 days
- 249
- 23
Zillow last checked:
Listing updated:
Listed by:
Christine Moore 413-206-6230,
Crescent Hill Real Estate 413-206-6230,
Christine Moore 413-206-6230
Source: MLS PIN,MLS#: 73579288
Facts & features
Interior
Bedrooms & bathrooms
- Bedrooms: 9
- Bathrooms: 3
- Full bathrooms: 2
- 1/2 bathrooms: 1
Features
- Has basement: Yes
- Has fireplace: No
Interior area
- Total structure area: 2,896
- Total interior livable area: 2,896 sqft
- Finished area above ground: 2,896
Property
Parking
- Total spaces: 6
- Parking features: Paved Drive
- Garage spaces: 2
- Uncovered spaces: 4
Lot
- Size: 5,998 Square Feet
Details
- Parcel number: S:12155 P:0037,2611388
- Zoning: R2
Construction
Type & style
- Home type: MultiFamily
- Property subtype: Multi Family
Materials
- Foundation: Concrete Perimeter
Condition
- Year built: 1922
Utilities & green energy
- Sewer: Public Sewer
- Water: Public
Community & HOA
Community
- Features: Public Transportation, Public School
Location
- Region: Springfield
Financial & listing details
- Price per square foot: $150/sqft
- Tax assessed value: $309,700
- Annual tax amount: $4,856
- Date on market: 9/17/2026
- Total actual rent: 1650
Estimated market value
$433,200
$412,000 - $455,000
$1,830/mo
Price history
| Date | Event | Price |
|---|---|---|
| 11/4/2026 | Contingent | $435,000$150/sqft |
Source: MLS PIN #73579288 Report a problem | ||
| 9/17/2026 | Listed for sale | $435,000+191.9%$150/sqft |
Source: MLS PIN #73579288 Report a problem | ||
| 2/27/2009 | Sold | $149,000$51/sqft |
Source: Public Record Report a problem | ||
Public tax history
| Year | Property taxes | Tax assessment |
|---|---|---|
| 2025 | $4,856 +19.8% | $309,700 +22.7% |
| 2024 | $4,054 +1.7% | $252,400 +8% |
| 2023 | $3,985 +5.9% | $233,700 +16.9% |
| 2022 | $3,764 +1.9% | $200,000 +2.4% |
| 2021 | $3,693 +0.5% | $195,400 +3.9% |
| 2020 | $3,674 +3.8% | $188,100 +4.6% |
| 2019 | $3,538 +10.2% | $179,800 +10.2% |
| 2018 | $3,210 +11.3% | $163,100 +11.2% |
| 2017 | $2,884 +5.1% | $146,700 +5.2% |
| 2016 | $2,743 +1.6% | $139,500 +1.7% |
| 2015 | $2,699 -3.6% | $137,200 -3.4% |
| 2014 | $2,801 -0.3% | $142,100 -0.3% |
| 2013 | $2,809 +1.3% | $142,500 +1.9% |
| 2012 | $2,774 +1.4% | $139,900 -0.4% |
| 2011 | $2,736 +2.3% | $140,400 +2.3% |
| 2010 | $2,675 -5.2% | $137,200 -13% |
| 2009 | $2,821 -4.5% | $157,700 -14.4% |
| 2008 | $2,953 -9.4% | $184,200 -9.4% |
| 2007 | $3,259 +14.4% | $203,200 +21.2% |
| 2006 | $2,849 +20.3% | $167,600 +23.9% |
| 2005 | $2,369 -1.5% | $135,300 +6.8% |
| 2004 | $2,406 +16.6% | $126,700 +19.2% |
| 2003 | $2,063 +3.3% | $106,300 +5.8% |
| 2002 | $1,998 | $100,500 |
Find assessor info on the county website
Monthly payment
Est. payment
Payment breakdown
Explore the cost of this home by adjusting the details. Changes won't be saved.Climate risks
Neighborhood: Forest Park


Similar homes
- $--6 bd3 ba2.3k sqft22 Sorrento St, Springfield, MA 01108Auction
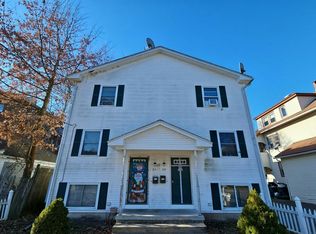 Auction.com 2
- $499,9998 bd3 ba2.5k sqft354-356 White St, Springfield, MA 01108For Sale
 MLS ID #73579350, Jarelis Rodriguez, Coldwell Banker Realty - Western MA. MLS PIN
- $414,9008 bd3 ba2.8k sqft101-103 Draper St, Springfield, MA 01108For Sale
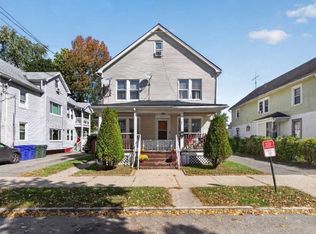 MLS ID #73593185, Julie Sor, PRIVI Realty LLC. MLS PIN
- $429,9006 bd3 ba2.9k sqft91-93 Malden St, Springfield, MA 01108For Sale
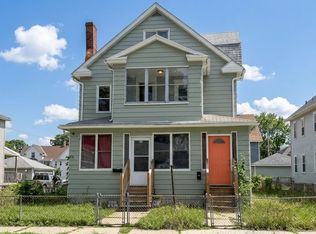 MLS ID #73571371, Paul Hernandez, Five Stars Realty LLC. MLS PIN
