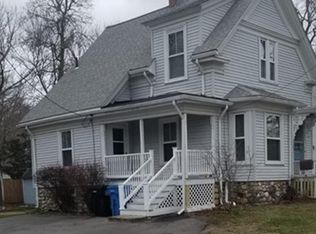
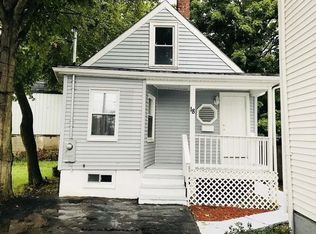
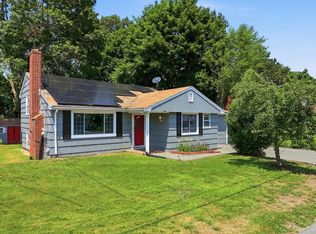
Welcome to this inviting 3-bedroom, 2-bath home offering 1,544 sq ft of comfortable living space. The layout provides a great flow for everyday living and entertaining. Bright interiors create a warm and welcoming atmosphere throughout. Enjoy the opportunity to personalize and make it your own. A great option for homeowners or investors alike. Property sold AS-IS
For sale
Price cut: $14K (7/2)
$395,000
129 Commercial St, Whitman, MA 02382
3beds
1,544sqft
Single Family Residence
Built in 1900
0.32 Acres Lot
$408,900 Zestimate®
$256/sqft
$-- HOA
What's special
Bright interiorsWarm and welcoming atmosphere
- 86 days |
- 1,820 |
- 46 |
Zillow last checked:
Listing updated:
Listed by:
Derek Greene 888-278-5840,
The Greene Realty Group 888-278-5840,
Derek Greene 888-278-5840
Source: MLS PIN,MLS#: 73499980
Loading...
Facts & features
Interior
Bedrooms & bathrooms
- Bedrooms: 3
- Bathrooms: 2
- Full bathrooms: 2
Heating
- Steam, Oil
Cooling
- None
Appliances
- Included: Water Heater
Features
- Basement: Interior Entry
- Has fireplace: No
Interior area
- Total structure area: 1,544
- Total interior livable area: 1,544 sqft
- Finished area above ground: 1,544
Property
Lot
- Size: 0.32 Acres
- Features: Level
Details
- Parcel number: M:028A B:0015 L:8,1203000
- Zoning: A2
Construction
Type & style
- Home type: SingleFamily
- Property subtype: Single Family Residence
Materials
- Foundation: Other
Condition
- Year built: 1900
Utilities & green energy
- Sewer: Public Sewer
- Water: Public
Community & HOA
HOA
- Has HOA: No
Location
- Region: Whitman
Financial & listing details
- Price per square foot: $256/sqft
- Tax assessed value: $422,300
- Annual tax amount: $5,541
- Date on market: 4/10/2026
Estimated market value
$408,900
$388,000 - $429,000
$3,484/mo
Price history
| Date | Event | Price |
|---|---|---|
| 7/2/2026 | Price change | $395,000-3.4%$256/sqft |
Source: MLS PIN #73499980 Report a problem | ||
| 6/30/2026 | Price change | $409,000-6.8%$265/sqft |
Source: MLS PIN #73499980 Report a problem | ||
| 6/5/2026 | Price change | $439,000-2.2%$284/sqft |
Source: MLS PIN #73499980 Report a problem | ||
| 5/29/2026 | Price change | $449,000-3.4%$291/sqft |
Source: MLS PIN #73499980 Report a problem | ||
| 5/20/2026 | Price change | $465,000-3.1%$301/sqft |
Source: MLS PIN #73499980 Report a problem | ||
| 5/11/2026 | Price change | $480,000-1.8%$311/sqft |
Source: MLS PIN #73499980 Report a problem | ||
| 5/1/2026 | Price change | $489,000-2%$317/sqft |
Source: MLS PIN #73499980 Report a problem | ||
| 4/28/2026 | Price change | $499,000-1.2%$323/sqft |
Source: MLS PIN #73499980 Report a problem | ||
| 4/22/2026 | Price change | $505,000-1.9%$327/sqft |
Source: MLS PIN #73499980 Report a problem | ||
| 4/10/2026 | Listed for sale | $515,000+325.6%$334/sqft |
Source: MLS PIN #73499980 Report a problem | ||
| 9/17/1998 | Sold | $121,000$78/sqft |
Source: Public Record Report a problem | ||
Public tax history
| Year | Property taxes | Tax assessment |
|---|---|---|
| 2025 | $5,541 +5.8% | $422,300 +2.7% |
| 2024 | $5,237 +5.2% | $411,100 +12.1% |
| 2023 | $4,976 +1.4% | $366,700 +8.8% |
| 2022 | $4,908 +3.7% | $337,100 +10.3% |
| 2021 | $4,735 +2% | $305,500 +4.3% |
| 2020 | $4,644 +5.9% | $293,000 +2.7% |
| 2019 | $4,386 +6.9% | $285,200 +11.3% |
| 2018 | $4,102 +6.2% | $256,200 |
| 2017 | $3,863 +3.3% | $256,200 +6.8% |
| 2016 | $3,738 +6.8% | $239,800 +6.9% |
| 2015 | $3,501 +1.1% | $224,300 +2.4% |
| 2014 | $3,464 +0.1% | $219,100 |
| 2013 | $3,460 +2.2% | $219,100 -5.4% |
| 2012 | $3,385 +4.8% | $231,500 -3.7% |
| 2011 | $3,229 +3.5% | $240,400 -4.4% |
| 2010 | $3,119 +4.7% | $251,500 -3.9% |
| 2009 | $2,979 -2.8% | $261,800 -6.9% |
| 2008 | $3,064 +2.6% | $281,100 +1.1% |
| 2007 | $2,986 -4.2% | $278,000 +1.1% |
| 2006 | $3,116 +6.8% | $275,000 +10% |
| 2005 | $2,918 -2.9% | $250,000 +43.9% |
| 2004 | $3,005 +2.9% | $173,700 +9% |
| 2003 | $2,919 +27.1% | $159,400 +43% |
| 2001 | $2,297 +1.5% | $111,500 |
| 2000 | $2,263 | $111,500 |
Find assessor info on the county website
Monthly payment
Est. payment$--/mo
Payment breakdown
Explore the cost of this home by adjusting the details. Changes won't be saved.All calculations are estimates and provided by Zillow, Inc. for informational purposes only. Actual amounts may vary.
HOA fees may include property taxes on listings classified as Co-Ops. Contact the listing agent and/or owner for fee details.
Mortgage interest rates are dependent on a number of factors, including credit score, down payment, and repayment length. Interest rate data provided by Zillow Group Marketplace, Inc. as of 1/1/1970 from various mortgage lenders with which we have lead or other similar arrangements; the Estimated Payment is an average of those rates.
See how much you could borrow to make a competitive offer.
Climate risks
Neighborhood: 02382
Nearby schools
GreatSchools rating
- 5/10John H Duval Elementary SchoolGrades: K-5Distance: 1 mi
- 4/10Whitman Middle SchoolGrades: 6-8Distance: 1.5 mi
- 6/10Whitman Hanson Regional High SchoolGrades: 9-12Distance: 1.3 mi
A local agent can set up tours, give advice and negotiate with sellers.
A local lender can help you make sure your offer is ready when you are.


- Massachusetts
- Plymouth County
- Whitman
- 02382
- 129 Commercial St
Nearby cities
Nearby zip codes
Other Whitman Topics
