Cozy up to the fireplace on chilly winter evenings in this unique 3-BR bungalow! Lots of recent improvements - roof was new in 2022, new HVAC in 2017 and a very spacious yard that includes 2 lots. Lots of room for kids to play and not a lot of traffic in this area! The upstairs master bedroom is very spacious with a lot of closet space and has 2 BR's on the main level. Hardwood floors, galley kitchen complete with appliances. Make an appointment soon to view this very nice house!
Active
$190,000
1304 Chester Ave, Ottumwa, IA 52501
3beds
1,305sqft
Single Family Residence
Built in 1935
7,405 Square Feet Lot
$-- Zestimate®
$146/sqft
$-- HOA
What's special
Hardwood floors
- 19 days
- 306
- 16
Zillow last checked:
Listing updated:
Listed by:
Lonnie D Lunsford 641-226-2235,
Team Real Estate
Source: NoCoast MLS as distributed by MLS GRID,MLS#: 6343327
Facts & features
Interior
Bedrooms & bathrooms
- Bedrooms: 3
- Bathrooms: 2
- Full bathrooms: 1
- 1/2 bathrooms: 1
Heating
- Forced Air
Cooling
- Central Air
Features
- Basement: Full
- Number of fireplaces: 1
Interior area
- Total interior livable area: 1,305 sqft
Property
Parking
- Total spaces: 2
- Parking features: Garage
- Garage spaces: 2
Accessibility
- Accessibility features: None
Lot
- Size: 7,405 Square Feet
- Dimensions: 100 x 298
Details
- Parcel number: 0074175401370
Construction
Type & style
- Home type: SingleFamily
- Architectural style: Bungalow
- Property subtype: Single Family Residence
Materials
- Vinyl Siding
Condition
- Year built: 1935
Utilities & green energy
- Sewer: Public Sewer
- Water: Public
Community & HOA
HOA
- Has HOA: No
Location
- Region: Ottumwa
Financial & listing details
- Price per square foot: $146/sqft
- Tax assessed value: $135,310
- Annual tax amount: $2,468
- Date on market: 10/2/2026
- Cumulative days on market: 20 days
Estimated market value
Not available
Estimated sales range
Not available
Not available
Price history
| Date | Event | Price |
|---|---|---|
| 10/2/2026 | Listed for sale | $190,000+26.7%$146/sqft |
Source:  NoCoast MLS as distributed by MLS GRID #6343327 Report a problem | ||
| 1/26/2023 | Sold | $150,000$115/sqft |
Source: NoCoast MLS as distributed by MLS GRID #6304696 Report a problem | ||
| 12/20/2022 | Pending sale | $150,000$115/sqft |
Source: NoCoast MLS as distributed by MLS GRID #6304696 Report a problem | ||
| 12/13/2022 | Listed for sale | $150,000+77.5%$115/sqft |
Source: NoCoast MLS as distributed by MLS GRID #6304696 Report a problem | ||
| 3/27/2015 | Sold | $84,500-2.3%$65/sqft |
Source: NoCoast MLS as distributed by MLS GRID #5387116 Report a problem | ||
| 2/15/2015 | Listed for sale | $86,500$66/sqft |
Source: Team Real Estate #30723 Report a problem | ||
Public tax history
| Year | Property taxes | Tax assessment |
|---|---|---|
| 2025 | $2,468 +5.6% | $135,310 +9.1% |
| 2024 | $2,338 +10.6% | $124,050 |
| 2023 | $2,114 +1.1% | $124,050 +27.4% |
| 2022 | $2,092 +16.1% | $97,360 +0.2% |
| 2021 | $1,802 -0.8% | $97,140 +22.3% |
| 2020 | $1,816 -2.5% | $79,450 |
| 2019 | $1,862 +1% | $79,450 |
| 2018 | $1,844 +2.3% | $79,450 |
| 2017 | $1,802 +2.4% | $79,450 +0.4% |
| 2016 | $1,760 -0.2% | $79,134 |
| 2015 | $1,764 | $79,134 |
| 2014 | $1,764 +7.2% | $79,134 |
| 2013 | $1,646 +0.9% | -- |
| 2012 | $1,632 +2% | -- |
| 2011 | $1,600 +2.3% | -- |
| 2010 | $1,564 +9.5% | -- |
| 2009 | $1,428 +3.6% | -- |
| 2008 | $1,378 +4.9% | -- |
| 2007 | $1,314 +10.8% | -- |
| 2005 | $1,186 | -- |
Find assessor info on the county website
Monthly payment
Est. payment
Payment breakdown
Explore the cost of this home by adjusting the details. Changes won't be saved.Climate risks
Neighborhood: 52501
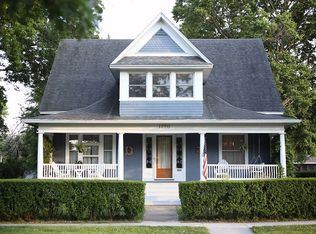
Similar homes
- $169,9003 bd2 ba1.1k sqft315 Osceola St, Ottumwa, IA 52501Active
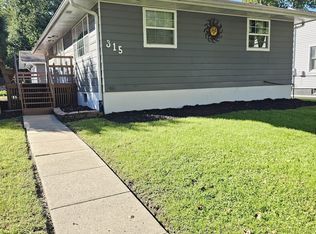 MLS ID #6341907, Pablo Zavala, Uplift Realty. NoCoast MLS as distributed by MLS GRID
- $159,0003 bd1 ba1.4k sqft1206 Greenwood Dr, Ottumwa, IA 52501Active
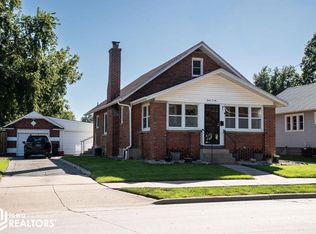 MLS ID #6343479, Joella Turner, Ottumwa Realty. NoCoast MLS as distributed by MLS GRID
- $179,9002 bd2 ba1k sqft733 Grace St, Ottumwa, IA 52501Active
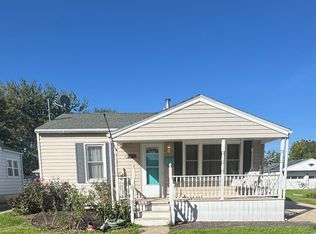 MLS ID #6343525, Trisha Rea, Bridge City Realty. NoCoast MLS as distributed by MLS GRID
- $179,0002 bd2 ba1.3k sqft9660 153rd Ave, Ottumwa, IA 52501Active
 MLS ID #6341022, Sarah Johnson, Bridge City Realty. NoCoast MLS as distributed by MLS GRID
