Completely remodeled Seminole Heights Home. This house has a brand new roof, HVAC , new kitchen with quartz counters and stainless appliances, many new impact windows. New luxury vinyl flooring throughout, painted inside and out, new trim, fans etc. Huge backyard ready for a pool to be installed
For sale
Price cut: $10K (11/9)
$279,900
1309 E LAMBRIGHT STREET, TAMPA, FL 33604
2beds
905sqft
Single Family Residence
Built in 1951
8,400 Square Feet Lot
$268,500 Zestimate®
$309/sqft
$-- HOA
What's special
Huge backyardBrand new roofPainted inside and outNew trimKitchen with quartz counters
- 6 days
- 183
- 15
Likely to sell faster than
Zillow last checked:
Listing updated:
Listed by:
Mark Helmling 813-598-7744,
BAY VISION REALTY INC 813-598-7744
Source: Stellar MLS,MLS#: TB8564761 Originating MLS: Suncoast Tampa
Facts & features
Interior
Bedrooms & bathrooms
- Bedrooms: 2
- Bathrooms: 1
- Full bathrooms: 1
Primary bedroom
- Features: Built-in Closet
- Level: First
Family room
- Level: First
Kitchen
- Level: First
Heating
- Central
Cooling
- Central Air
Appliances
- Included: Microwave, Range, Refrigerator
- Laundry: Inside
Features
- Ceiling Fan(s)
- Flooring: Luxury Vinyl
- Has fireplace: No
Interior area
- Total structure area: 1,130
- Total interior livable area: 905 sqft
Video & virtual tour
Property
Features
- Levels: One
- Stories: 1
- Exterior features: None
Lot
- Size: 8,400 Square Feet
- Dimensions: 60 x 140
Details
- Parcel number: A312819ZZZ00000587500.0
- Zoning: SH-RS
- Special conditions: None
Construction
Type & style
- Home type: SingleFamily
- Property subtype: Single Family Residence
Materials
- HardiPlank Type, Metal Siding, Wood Frame
- Foundation: Slab
- Roof: Shingle
Condition
- New construction: No
- Year built: 1951
Utilities & green energy
- Sewer: Public Sewer
- Water: Public
- Utilities for property: Electricity Connected
Community & HOA
Community
- Pet fee: $0 monthly
- Subdivision: UNPLATTED
HOA
- Has HOA: No
Location
- Region: Tampa
Financial & listing details
- Price per square foot: $309/sqft
- Tax assessed value: $198,828
- Annual tax amount: $4,049
- Date on market: 11/4/2026
- Cumulative days on market: 7 days
- Listing terms: Cash,Conventional,FHA
- Ownership: Fee Simple
- Total actual rent: 0
- Electric utility on property: Yes
- Road surface type: Asphalt
Foreclosure details
Estimated market value
$268,500
$255,000 - $282,000
$1,815/mo
Price history
| Date | Event | Price |
|---|---|---|
| 11/9/2026 | Price change | $279,900-3.4%$309/sqft |
Source:  Stellar MLS #TB8564761 Report a problem | ||
| 11/4/2026 | Listed for sale | $289,900+215.1%$320/sqft |
Source: Stellar MLS #TB8564761 Report a problem | ||
| 9/6/2024 | Listing removed | $1,875-1.1%$2/sqft |
Source: Zillow Rentals Report a problem | ||
| 8/16/2024 | Price change | $1,895-2.8%$2/sqft |
Source: Zillow Rentals Report a problem | ||
| 8/9/2024 | Price change | $1,950+4%$2/sqft |
Source: Zillow Rentals Report a problem | ||
| 7/29/2024 | Price change | $1,875-3.8%$2/sqft |
Source: Zillow Rentals Report a problem | ||
| 7/22/2024 | Price change | $1,950+1.3%$2/sqft |
Source: Zillow Rentals Report a problem | ||
| 7/8/2024 | Price change | $1,925-2.5%$2/sqft |
Source: Zillow Rentals Report a problem | ||
| 7/3/2024 | Price change | $1,975+2.6%$2/sqft |
Source: Zillow Rentals Report a problem | ||
| 6/22/2024 | Listed for rent | $1,925$2/sqft |
Source: Zillow Rentals Report a problem | ||
| 6/15/2024 | Listing removed | -- |
Source: Zillow Rentals Report a problem | ||
| 5/28/2024 | Price change | $1,925-1.3%$2/sqft |
Source: Zillow Rentals Report a problem | ||
| 5/6/2024 | Price change | $1,950-4.9%$2/sqft |
Source: Zillow Rentals Report a problem | ||
| 4/7/2024 | Listed for rent | $2,050+5.1%$2/sqft |
Source: Zillow Rentals Report a problem | ||
| 2/13/2024 | Listing removed | -- |
Source: Zillow Rentals Report a problem | ||
| 2/5/2024 | Listed for rent | $1,950-1.3%$2/sqft |
Source: Zillow Rentals Report a problem | ||
| 1/12/2024 | Listing removed | -- |
Source: Zillow Rentals Report a problem | ||
| 12/14/2023 | Listed for rent | $1,975-1%$2/sqft |
Source: Zillow Rentals Report a problem | ||
| 11/20/2023 | Listing removed | -- |
Source: Zillow Rentals Report a problem | ||
| 10/24/2023 | Price change | $1,995-2.7%$2/sqft |
Source: Zillow Rentals Report a problem | ||
| 10/20/2023 | Price change | $2,050+2.8%$2/sqft |
Source: Zillow Rentals Report a problem | ||
| 10/3/2023 | Price change | $1,995-5%$2/sqft |
Source: Zillow Rentals Report a problem | ||
| 9/8/2023 | Listed for rent | $2,100$2/sqft |
Source: Zillow Rentals Report a problem | ||
| 2/8/2018 | Sold | $92,000+46%$102/sqft |
Source: Public Record Report a problem | ||
| 1/26/2015 | Sold | $63,000-65.6%$70/sqft |
Source: Public Record Report a problem | ||
| 4/25/2006 | Sold | $183,000+53.8%$202/sqft |
Source: Public Record Report a problem | ||
| 8/12/2005 | Sold | $119,000$131/sqft |
Source: Public Record Report a problem | ||
Public tax history
| Year | Property taxes | Tax assessment |
|---|---|---|
| 2025 | $4,050 +8% | $198,828 +7.9% |
| 2024 | $3,748 +7.5% | $184,283 +10% |
| 2023 | $3,487 +6.5% | $167,530 +10% |
| 2022 | $3,276 +13.5% | $152,300 +10% |
| 2021 | $2,886 +11% | $138,455 +10% |
| 2020 | $2,599 +5.8% | $125,868 +6.7% |
| 2019 | $2,456 | $117,933 +16.7% |
| 2018 | $2,456 +32.2% | $101,066 +21.4% |
| 2017 | $1,858 +12.3% | $83,279 +26% |
| 2016 | $1,654 +15.8% | $66,102 +17.3% |
| 2015 | $1,428 +263.7% | $56,341 +31.9% |
| 2014 | $393 | $42,709 +1.5% |
| 2013 | $393 +4.8% | $42,078 +1.7% |
| 2012 | $375 -32.8% | $41,375 -17% |
| 2011 | $558 -9.8% | $49,831 -14% |
| 2010 | $618 -16% | $57,939 -20.4% |
| 2009 | $736 -54.6% | $72,767 -36.7% |
| 2008 | $1,623 -19.2% | $114,897 -2.4% |
| 2007 | $2,009 -20.4% | $117,748 +10.4% |
| 2006 | $2,522 +31.7% | $106,681 +36.1% |
| 2005 | $1,915 | $78,388 +25.1% |
| 2004 | -- | $62,669 +14.9% |
| 2003 | -- | $54,554 +2.2% |
| 2002 | -- | $53,395 +12.8% |
| 2001 | -- | $47,324 +13.2% |
| 2000 | $1,066 | $41,798 |
Find assessor info on the county website
Monthly payment
Est. payment
Payment breakdown
Explore the cost of this home by adjusting the details. Changes won't be saved.Climate risks
Neighborhood: Old Seminole Heights

Similar homes
- $284,9002 bd1 ba672 sqft502 E KNOLLWOOD STREET, TAMPA, FL 33604For Sale

 MLS ID #TB8521713, Dirk Peters, HEIGHTS REALTY. Stellar MLS
- $299,9003 bd2 ba1k sqft3001 N 45 STREET, TAMPA, FL 33605For Sale
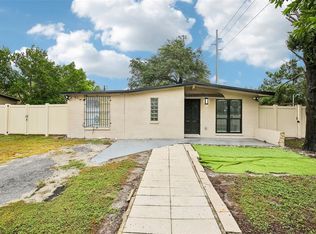 MLS ID #TB8564114, David Morales, REDFIN CORPORATION. Stellar MLS
- $339,0002 bd3 ba1.1k sqft6714 N HARER STREET, TAMPA, FL 33604For Sale
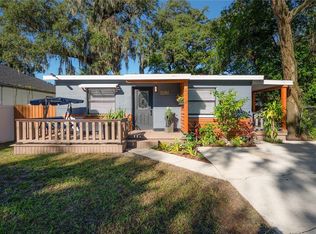 MLS ID #TB8558921, Leslie Sibbitt, COMPASS FLORIDA LLC. Stellar MLS
- $319,9002 bd1 ba837 sqft39 HAMILTON HEATH DRIVE, TAMPA, FL 33604For Sale
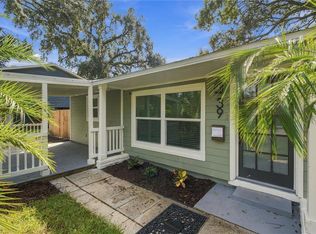 MLS ID #TB8557132, Anton Lennartsson, SMITH & ASSOCIATES REAL ESTATE. Stellar MLS
- $296,9003 bd2 ba1.1k sqft1705 E BIRD STREET, TAMPA, FL 33604For SaleMLS ID #TB8536180, Lynne Powers, POWERS REAL ESTATE SOLUTIONS LLC. Stellar MLS
- $179,9003 bd2 ba1k sqft8006 N MULBERRY STREET, TAMPA, FL 33604For SaleMLS ID #TB8555994, Stacey Chais, KELLER WILLIAMS TAMPA CENTRAL. Stellar MLS
- $320,0002 bd1 ba944 sqft8904 N 20TH STREET, TAMPA, FL 33604For SaleMLS ID #TB8537911, Fatima Poche, HOME PRIME REALTY LLC. Stellar MLS
- $289,0003 bd1 ba912 sqft1210 E 32ND AVENUE, TAMPA, FL 33603For SaleMLS ID #TB8535226, Cindy Drummond, REAVES REAL ESTATE PROFESSIONALS LLC. Stellar MLS
- $234,9003 bd2 ba924 sqft8014 N ALASKA STREET, TAMPA, FL 33604For SaleMLS ID #TB8345799, Rima Jbour, CENTURY 21 ROSA LEON. Stellar MLS
- $320,0004 bd1 ba1.2k sqft(Undisclosed Address), TAMPA, FL 33604For SaleMLS ID #TB8433847, Christine Turner, EXP REALTY LLC. Stellar MLS
- $277,5003 bd1 ba1k sqft(Undisclosed Address), TAMPA, FL 33617For SaleMLS ID #TB8554200, Sulerky Aruca, FLORIDA ALLIANCE PROPERTIES LLC. Stellar MLS
- $254,9003 bd1 ba893 sqft4104 N 20TH STREET, TAMPA, FL 33610For SaleMLS ID #TB8550893, Tom Player, CHARLES RUTENBERG REALTY INC. Stellar MLS
- $239,9993 bd1 ba850 sqft4615 N 38TH STREET, TAMPA, FL 33610For SaleMLS ID #TB8558042, Donna Parrish, CHARLES RUTENBERG REALTY INC. Stellar MLS
- $214,9002 bd1 ba852 sqft910 E ESKIMO AVENUE, TAMPA, FL 33604For SaleMLS ID #TB8554667, Aprilyn Cloyd, REALTY ONE GROUP INNOVATION. Stellar MLS
- $249,9003 bd2 ba960 sqft3311 E CHELSEA STREET, TAMPA, FL 33610For SaleMLS ID #TB8535530, Bradley Chais, KELLER WILLIAMS TAMPA CENTRAL. Stellar MLS
- $299,9004 bd2 ba1.1k sqft4402 N 72ND STREET, TAMPA, FL 33610For SaleMLS ID #O6448155, Steven Koleno, BEYCOME OF FLORIDA LLC. Stellar MLS
- $255,0003 bd1 ba812 sqft4214 E PALIFOX STREET, TAMPA, FL 33610For SaleMLS ID #TB8543350, Kristen Chester, DALTON WADE INC. Stellar MLS
- $219,9002 bd1 ba656 sqft1812 E OKALOOSA AVENUE, TAMPA, FL 33604For SaleMLS ID #TB8526411, Ana Acosta, NEW BEGINNING REALTY LLC. Stellar MLS
- $349,7773 bd2 ba1.3k sqft936 E SHADOWLAWN AVENUE, TAMPA, FL 33603For SaleMLS ID #TB8556226, Gersson Perez, RE FLORIDA HOMES. Stellar MLS
- $210,0002 bd1 ba1k sqft8609 N 13TH STREET, TAMPA, FL 33604For SaleMLS ID #TB8514657, Juan Sanchez, FUTURE HOME REALTY INC. Stellar MLS
