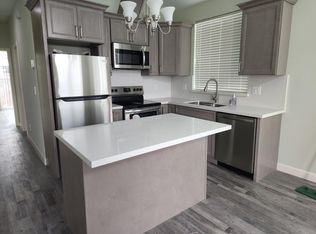
Property to be shown Monday Oct. 17, 2011 between 1:00p- 2:30p for now. Property needs TLC. Good floor plan with ample storage area. Convenient to freeway and walking distance to shopping.
Pre-foreclosure
Est. $1,098,200
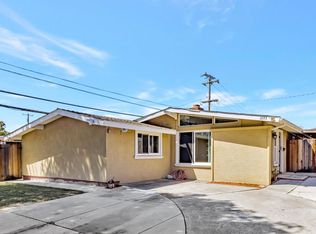
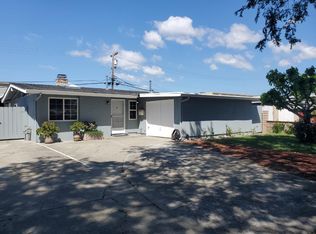
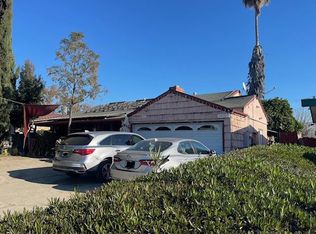
1331 S King Rd, San Jose, CA 95122
5beds
3baths
2,232sqft
SingleFamily
Built in 1959
5,883 Square Feet Lot
$1,098,200 Zestimate®
$492/sqft
$-- HOA
Overview
- 322 days |
- 15 |
- 0 |
Facts & features
Interior
Bedrooms & bathrooms
- Bedrooms: 5
- Bathrooms: 3
Heating
- Other
Features
- Has fireplace: Yes
Interior area
- Total interior livable area: 2,232 sqft
Property
Parking
- Parking features: Garage - Attached
Lot
- Size: 5,883 Square Feet
Details
- Parcel number: 48609061
Construction
Type & style
- Home type: SingleFamily
Materials
- wood frame
Condition
- Year built: 1959
Community & HOA
Location
- Region: San Jose
Financial & listing details
- Price per square foot: $492/sqft
- Tax assessed value: $282,716
- Annual tax amount: $6,099
Visit our professional directory to find a foreclosure specialist in your area that can help with your home search.
Find a foreclosure agentForeclosure details
Estimated market value
$1,098,200
$999,000 - $1.20M
$5,522/mo
Price history
| Date | Event | Price |
|---|---|---|
| 3/4/2013 | Sold | $230,000-24.6%$103/sqft |
Source: Public Record Report a problem | ||
| 11/6/2011 | Listing removed | $305,000$137/sqft |
Source: Coldwell Banker The Professional Group #81143827 Report a problem | ||
| 10/16/2011 | Listed for sale | $305,000$137/sqft |
Source: Coldwell Banker The Professional Group #81143827 Report a problem | ||
Public tax history
| Year | Property taxes | Tax assessment |
|---|---|---|
| 2025 | $6,099 +2.5% | $282,716 +2% |
| 2024 | $5,949 +2.7% | $277,174 +2% |
| 2023 | $5,793 +2.1% | $271,740 +2% |
| 2022 | $5,672 +4.4% | $266,413 +2% |
| 2021 | $5,434 +4% | $261,190 +1% |
| 2020 | $5,227 | $258,513 +2% |
| 2019 | $5,227 +5.5% | $253,445 +2% |
| 2018 | $4,954 | $248,476 +2% |
| 2017 | $4,954 +0.3% | $243,605 +2% |
| 2016 | $4,938 +6% | $238,829 +1.5% |
| 2015 | $4,660 +22.3% | $235,243 +2% |
| 2014 | $3,809 | $230,636 +11.9% |
| 2013 | -- | $206,200 -30.6% |
| 2012 | -- | $297,000 -8.5% |
| 2011 | -- | $324,516 +0.8% |
| 2010 | -- | $322,092 -0.2% |
| 2009 | -- | $322,858 +2% |
| 2008 | -- | $316,528 +2% |
| 2007 | -- | $310,323 +2% |
| 2006 | -- | $304,239 +2% |
| 2005 | -- | $298,274 +2% |
| 2004 | -- | $292,427 +1.9% |
| 2003 | -- | $287,068 +2% |
| 2002 | -- | $281,440 +2% |
| 2001 | -- | $275,923 |
Find assessor info on the county website
Monthly payment
Estimated monthly payment$1,822
All calculations are estimates and provided by Zillow, Inc. for informational purposes only. Actual amounts may vary.
HOA fees may include property taxes on listings classified as Co-Ops. Contact the listing agent and/or owner for fee details.
Mortgage interest rates are dependent on a number of factors, including credit score, down payment, and repayment length. Interest rate data provided by Zillow Group Marketplace, Inc. as of 1/1/1970 from various mortgage lenders with which we have lead or other similar arrangements; the Estimated Payment is an average of those rates.
See how much you could borrow to make a competitive offer.
Climate risks
Neighborhood: East San Jose
Nearby schools
GreatSchools rating
- 2/10O. S. Hubbard Elementary SchoolGrades: K-8Distance: 0.4 mi
- 3/10William C. Overfelt High SchoolGrades: 9-12Distance: 0.7 mi
- 5/10Ocala Middle SchoolGrades: 6-8Distance: 1.4 mi


- California
- Santa Clara County
- San Jose
- 95122
- East San Jose
- 1331 S King Rd
Nearby cities
Nearby neighborhoods
Nearby zip codes
Other San Jose Topics
