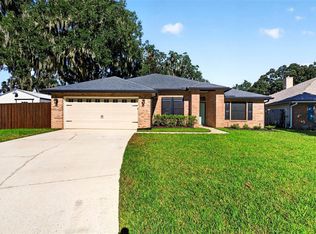
Quiet Cul-De-Sac home, inground pool with safety fence. Screened in Lanai. Perfect combo of comfort, privacy and Florida Living.
Active
Price cut: $10.1K (10/17)
$424,900
1342 PORTSIDE Drive, Orange Park, FL 32003
4beds
1,959sqft
Single Family Residence
Built in 1995
9,147 Square Feet Lot
$419,200 Zestimate®
$217/sqft
$23/mo HOA
What's special
Screened in lanaiQuiet cul-de-sac home
- 11 days
- 681
- 55
Likely to sell faster than
Zillow last checked:
Listing updated:
Listed by:
AILEEN CUADRA-ROQUE 239-791-0818,
BETANCES BROKERAGE LLC 239-791-0818
Source: realMLS,MLS#: 2171447
Facts & features
Interior
Bedrooms & bathrooms
- Bedrooms: 4
- Bathrooms: 2
- Full bathrooms: 2
Heating
- Central
Cooling
- Central Air
Appliances
- Included: Electric Oven, Electric Range, Freezer, Microwave, Refrigerator
- Laundry: Electric Dryer Hookup, Washer Hookup
Features
- Has fireplace: Yes
- Fireplace features: Other
Interior area
- Total interior livable area: 1,959 sqft
Property
Parking
- Total spaces: 2
- Parking features: Garage, Garage Door Opener, Guest
- Garage spaces: 2
Features
- Stories: 1
- Exterior features: Other
- Pool features: In Ground, Electric Heat
- Fencing: Fenced,Other
Lot
- Size: 9,147 Square Feet
- Features: Cul-De-Sac
Details
- Parcel number: 44042601407500338
Construction
Type & style
- Home type: SingleFamily
- Architectural style: Ranch
- Property subtype: Single Family Residence
Materials
- Roof: Concrete,Shingle
Condition
- Updated/Remodeled
- New construction: No
- Year built: 1995
Utilities & green energy
- Sewer: Public Sewer
- Water: Public
- Utilities for property: Cable Available, Sewer Available, Water Available
Community & HOA
Community
- Subdivision: Harbour Island
HOA
- Has HOA: Yes
- HOA fee: $275 annually
Location
- Region: Fleming Island
Financial & listing details
- Price per square foot: $217/sqft
- Tax assessed value: $366,629
- Annual tax amount: $5,214
- Date on market: 10/29/2026
- Listing terms: Cash,Conventional,FHA
- Road surface type: Asphalt
Estimated market value
$419,200
$398,000 - $440,000
$2,806/mo
Price history
| Date | Event | Price |
|---|---|---|
| 10/17/2026 | Price change | $424,900-2.3%$217/sqft |
Source:  SWFLMLS #226035825 Report a problem | ||
| 10/5/2026 | Listed for sale | $435,000-5.9%$222/sqft |
Source: SWFLMLS #226035825 Report a problem | ||
| 11/14/2022 | Sold | $462,500+2.8%$236/sqft |
Source:  realMLS #1187783 Report a problem | ||
| 10/17/2022 | Pending sale | $450,000$230/sqft |
Source: realMLS #1187783 Report a problem | ||
| 8/29/2022 | Listed for sale | $450,000$230/sqft |
Source: realMLS #1187783 Report a problem | ||
| 8/26/2022 | Contingent | $450,000$230/sqft |
Source: realMLS #1187783 Report a problem | ||
| 8/25/2022 | Listed for sale | $450,000+69.8%$230/sqft |
Source: realMLS #1187783 Report a problem | ||
| 6/13/2018 | Sold | $265,000+0%$135/sqft |
Source: realMLS #932892 Report a problem | ||
| 5/19/2018 | Pending sale | $264,999$135/sqft |
Source: First Coast Sotheby's International Realty #932892 Report a problem | ||
| 4/25/2018 | Listed for sale | $264,999+28%$135/sqft |
Source: FIRST COAST SOTHEBYS INTERNATIONAL REALTY #932892 Report a problem | ||
| 3/20/2015 | Sold | $207,000-3.2%$106/sqft |
Source: Public Record Report a problem | ||
| 11/8/2014 | Price change | $213,900-2.3%$109/sqft |
Source: RE/MAX Sterling #725119 Report a problem | ||
| 10/7/2014 | Price change | $218,900-0.5%$112/sqft |
Source: RE/MAX Sterling #725119 Report a problem | ||
| 9/24/2014 | Price change | $219,900-2.2%$112/sqft |
Source: RE/MAX Sterling #725119 Report a problem | ||
| 8/24/2014 | Price change | $224,900+2.3%$115/sqft |
Source: RE/MAX Sterling #725119 Report a problem | ||
| 6/28/2014 | Listed for sale | $219,900+10%$112/sqft |
Source: RE/MAX Sterling #725119 Report a problem | ||
| 5/22/2013 | Listing removed | $199,900$102/sqft |
Source: Full Service Realty Report a problem | ||
| 3/29/2013 | Listed for sale | $199,900+29%$102/sqft |
Source: Full Service Realty Report a problem | ||
| 7/26/2001 | Sold | $155,000$79/sqft |
Source: Public Record Report a problem | ||
Public tax history
| Year | Property taxes | Tax assessment |
|---|---|---|
| 2025 | -- | $358,529 +2.9% |
| 2024 | $4,995 +1.5% | $348,425 +1.8% |
| 2023 | $4,921 +116.3% | $342,204 +95.4% |
| 2022 | $2,275 +0.5% | $175,155 +3% |
| 2021 | $2,265 +3.4% | $170,054 +1.4% |
| 2020 | $2,190 | $167,707 +2.3% |
| 2019 | $2,190 +1.6% | $163,937 -11.9% |
| 2018 | $2,156 -8% | $186,116 +2.1% |
| 2017 | $2,345 +62.9% | $182,288 +1.3% |
| 2016 | $1,439 -51% | $180,016 +4.4% |
| 2015 | $2,939 +1.1% | $172,476 +10.4% |
| 2014 | $2,906 | $156,262 +6.6% |
| 2013 | -- | $146,648 +0.2% |
| 2012 | -- | $146,311 -2.3% |
| 2011 | -- | $149,720 +1.5% |
| 2010 | -- | $147,578 +2.7% |
| 2009 | -- | $143,698 +0.1% |
| 2008 | -- | $143,554 +3% |
| 2007 | -- | $139,373 +2.5% |
| 2006 | -- | $135,974 +3% |
| 2005 | -- | $132,014 +3% |
| 2004 | -- | $128,169 +1.9% |
| 2003 | -- | $125,779 +8.3% |
| 2001 | -- | $116,120 +3% |
| 2000 | -- | $112,738 |
Find assessor info on the county website
Monthly payment
Est. payment
Payment breakdown
Explore the cost of this home by adjusting the details. Changes won't be saved.Climate risks
Neighborhood: 32003
- $364,7004 bd2 ba1.7k sqft1338 Portside Dr, Fleming Island, FL 32003Off Market
- $354,8003 bd2 ba2k sqft1359 Keel Ct, Fleming Island, FL 32003Off Market
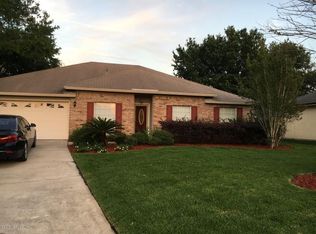
- $363,4003 bd2 ba2k sqft1346 Portside Dr, Fleming Island, FL 32003Off Market
- $304,1003 bd2 ba1.4k sqft1334 Portside Dr, Fleming Island, FL 32003Off Market
Similar homes
- $469,9004 bd3 ba2.3k sqft2275 FOXWOOD Drive, Orange Park, FL 32073For Sale
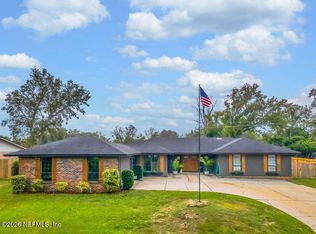 MLS ID #2156061, JENNY MOSELY. realMLS
- $430,0003 bd2 ba1.5k sqft11936 MARABOU Court S, Jacksonville, FL 32223For Sale
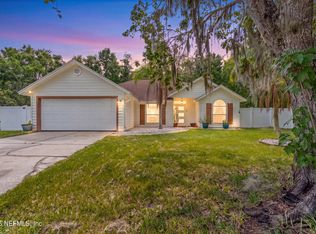 MLS ID #2156148, DALINA ELMASLLARI. realMLS
- $369,0003 bd2 ba1.4k sqft3660 MANDARIN WOODS Drive N, Jacksonville, FL 32223For Sale
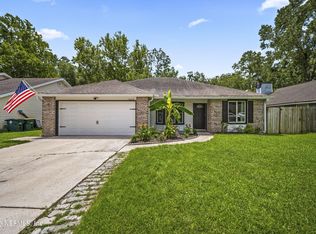 MLS ID #2131305, AARON MURRAY. realMLS
- $460,0004 bd2 ba2k sqft4683 ILAH ROAD N, JACKSONVILLE, FL 32257For Sale
 MLS ID #O6445476, Annemarie Baxter, MILLER GRANT AND COMPANY. Stellar MLS
- $459,9995 bd3 ba2.2k sqft3276 WOODGLEN DRIVE, ORANGE PARK, FL 32065For SaleMLS ID #O6429843, Carlos Diaz Diaz, V PROPERTIES INC. Stellar MLS
