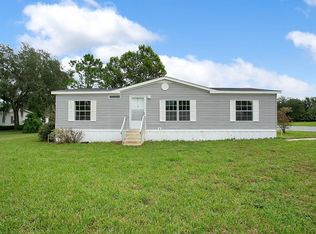
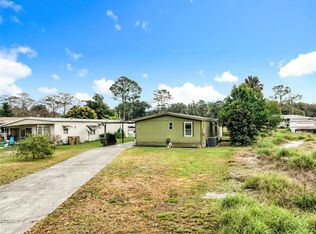
Welcome to this well maintained 3 Bedroom 2 Bath home. The kitchen has lots of cabinets and counter space, with stainless steel appliances. This home has a split floor plan with 16 inch tiled/carpet floors and boasts 1,620 sqft of open living space. The laundry is located inside the home There is a storage shed just outside on the covered screened porch. HOA Fees include water, sewer, and community pool. A public boat ramp to Harris Chain of Lakes is only 1.25 miles away!!
Pre-foreclosure
Est. $227,400
14213 Goldrush Ct, Astatula, FL 34705
3beds
1,620sqft
MobileManufactured
Built in 2005
6,682 Square Feet Lot
$227,400 Zestimate®
$140/sqft
$150/mo HOA
Overview
- 240 days |
- 2 |
- 0 |
Facts & features
Interior
Bedrooms & bathrooms
- Bedrooms: 3
- Bathrooms: 2
- Full bathrooms: 2
Heating
- Forced air, Electric
Cooling
- Central
Appliances
- Included: Dishwasher, Dryer, Microwave, Washer
Interior area
- Total interior livable area: 1,620 sqft
Property
Parking
- Parking features: Carport
Features
- Exterior features: Vinyl
Lot
- Size: 6,682 Square Feet
Details
- Parcel number: 282026130000004900
Construction
Type & style
- Home type: MobileManufactured
Materials
- Frame
- Foundation: Piers
- Roof: Shake / Shingle
Condition
- Year built: 2005
Community & HOA
HOA
- Has HOA: Yes
- HOA fee: $150 monthly
Location
- Region: Astatula
Financial & listing details
- Price per square foot: $140/sqft
- Tax assessed value: $154,237
- Annual tax amount: $3,743
Visit our professional directory to find a foreclosure specialist in your area that can help with your home search.
Find a foreclosure agentForeclosure details
Estimated market value
$227,400
$214,000 - $241,000
$2,097/mo
Price history
| Date | Event | Price |
|---|---|---|
| 4/8/2022 | Sold | $193,500-0.8%$119/sqft |
Source: Public Record Report a problem | ||
| 3/1/2022 | Pending sale | $195,000$120/sqft |
Source: BHHS broker feed #G5051229 Report a problem | ||
| 2/24/2022 | Listed for sale | $195,000$120/sqft |
Source: BHHS broker feed #G5051229 Report a problem | ||
| 2/16/2022 | Pending sale | $195,000$120/sqft |
Source: BHHS broker feed #G5051229 Report a problem | ||
| 2/13/2022 | Listed for sale | $195,000$120/sqft |
Source: BHHS broker feed #G5051229 Report a problem | ||
| 2/5/2022 | Pending sale | $195,000$120/sqft |
Source: BHHS broker feed #G5051229 Report a problem | ||
| 1/30/2022 | Listed for sale | $195,000+387.5%$120/sqft |
Source: | ||
| 12/10/2009 | Listing removed | $40,000$25/sqft |
Source: foreclosure.com Report a problem | ||
| 11/14/2009 | Price change | $40,000-11.1%$25/sqft |
Source: foreclosure.com Report a problem | ||
| 10/11/2009 | Price change | $45,000-14.9%$28/sqft |
Source: foreclosure.com Report a problem | ||
| 9/12/2009 | Price change | $52,900-8.6%$33/sqft |
Source: foreclosure.com Report a problem | ||
| 8/9/2009 | Price change | $57,900-10.9%$36/sqft |
Source: foreclosure.com Report a problem | ||
| 8/1/2009 | Price change | -- |
Source: foreclosure.com Report a problem | ||
| 6/27/2009 | Price change | $65,000-15.5%$40/sqft |
Source: foreclosure.com Report a problem | ||
| 3/2/2009 | Listed for sale | $76,900+174.6%$47/sqft |
Source: foreclosure.com Report a problem | ||
| 7/20/2005 | Sold | $28,000$17/sqft |
Source: Public Record Report a problem | ||
Public tax history
| Year | Property taxes | Tax assessment |
|---|---|---|
| 2025 | $3,743 -0.9% | $154,237 |
| 2024 | $3,777 +6.4% | $154,237 +2.5% |
| 2023 | $3,550 +248.5% | $150,470 +156.3% |
| 2022 | $1,019 +2.2% | $58,720 +3% |
| 2021 | $997 -3.1% | $57,012 +1.4% |
| 2020 | $1,029 +0.7% | $56,225 +2.3% |
| 2019 | $1,022 +3.5% | $54,961 +1.9% |
| 2018 | $988 | $53,937 +2.1% |
| 2017 | $988 +3.4% | $52,828 +2.1% |
| 2016 | $955 -0.3% | $51,742 +0.7% |
| 2015 | $957 +26.3% | $51,383 +0.8% |
| 2014 | $758 +41.8% | $50,976 -3.1% |
| 2013 | $535 -0.8% | $52,610 |
| 2012 | $539 -5% | $52,610 -5.4% |
| 2011 | $567 -32% | $55,626 -32.9% |
| 2010 | $833 -57.1% | $82,961 -17.9% |
| 2009 | $1,941 -12.7% | $101,035 -12.8% |
| 2008 | $2,224 +32% | $115,843 +2.9% |
| 2007 | $1,685 -5.4% | $112,591 |
| 2006 | $1,782 +319% | $112,591 +429.8% |
| 2005 | $425 +8.7% | $21,252 |
| 2004 | $391 | -- |
Find assessor info on the county website
Monthly payment
Estimated monthly payment$1,822
All calculations are estimates and provided by Zillow, Inc. for informational purposes only. Actual amounts may vary.
HOA fees may include property taxes on listings classified as Co-Ops. Contact the listing agent and/or owner for fee details.
Mortgage interest rates are dependent on a number of factors, including credit score, down payment, and repayment length. Interest rate data provided by Zillow Group Marketplace, Inc. as of 1/1/1970 from various mortgage lenders with which we have lead or other similar arrangements; the Estimated Payment is an average of those rates.
See how much you could borrow to make a competitive offer.
Climate risks
Neighborhood: 34705
Nearby schools
GreatSchools rating
- 5/10Astatula Elementary SchoolGrades: PK-5Distance: 0.3 mi
- 5/10Tavares Middle SchoolGrades: 6-8Distance: 4.3 mi
- 4/10Tavares High SchoolGrades: 9-12Distance: 6.7 mi


- Florida
- Lake County
- Astatula
- 34705
- 14213 Goldrush Ct
Nearby cities
Nearby zip codes
Other Astatula Topics
