Fully gut-renovated, condo-quality three-family property conveniently located just off Route 1, offering easy access to the Tobin Bridge and Downtown Boston.UNIT LAYOUTS: The property features two spacious three-bedroom residences, each with additional space suitable for a home office or potential fourth bedroom. The first-floor residence offers two bedrooms plus a dedicated home office. The top-floor three-bedroom unit has been intentionally vacated, providing an excellent opportunity for owner-occupancy or additional rental income.Each residence features luxury vinyl plank flooring, granite countertops, stainless steel Amana appliances, gas ranges, dishwashers, and updated bathrooms with quality fixtures and tile flooring.Major improvements include a new roof, windows, electrical systems, and Navien tankless heating and hot water systems. Additional amenities include coin-operated laundry and individual basement storage.A turnkey investment opportunity offering modern finishes, extensive capital improvements, and owner-occupancy flexibility.
For sale
$1,125,000
148 Walnut St, Chelsea, MA 02150
8beds
3,735sqft
3 Family
Built in 1900
-- sqft lot
$1,097,100 Zestimate®
$301/sqft
$-- HOA
What's special
New roofGranite countertopsStainless steel amana appliancesGas rangesLuxury vinyl plank flooringSpacious three-bedroom residences
- 4 days
- 141
- 7
Zillow last checked:
Listing updated:
Listed by:
Dan Pouladian 617-548-7737,
North Shore Realty Advisors 617-548-7737
Source: MLS PIN,MLS#: 73594726
Facts & features
Interior
Bedrooms & bathrooms
- Bedrooms: 8
- Bathrooms: 3
- Full bathrooms: 3
Features
- Basement: Full
- Has fireplace: No
Interior area
- Total structure area: 3,735
- Total interior livable area: 3,735 sqft
- Finished area above ground: 3,735
Property
Lot
- Size: 1,428 Square Feet
- Features: Corner Lot
Details
- Foundation area: 9999
- Parcel number: M:0037 B:0000 L:0022,1287625
- Zoning: R3
Construction
Type & style
- Home type: MultiFamily
- Property subtype: 3 Family
Materials
- Foundation: Stone
- Roof: Rubber
Condition
- Year built: 1900
Utilities & green energy
- Electric: 200+ Amp Service
- Sewer: Public Sewer
- Water: Public
Community & HOA
Community
- Features: Public Transportation, Shopping
Location
- Region: Chelsea
Financial & listing details
- Price per square foot: $301/sqft
- Tax assessed value: $1,039,600
- Annual tax amount: $11,935
- Date on market: 10/24/2026
- Total actual rent: 10000
Estimated market value
$1,097,100
$1.04M - $1.15M
$2,059/mo
Price history
| Date | Event | Price |
|---|---|---|
| 10/24/2026 | Listed for sale | $1,125,000+13.1%$301/sqft |
Source: MLS PIN #73594726 Report a problem | ||
| 8/7/2023 | Sold | $995,000+4.7%$266/sqft |
Source: MLS PIN #73119095 Report a problem | ||
| 6/1/2023 | Listed for sale | $950,000+17.3%$254/sqft |
Source: MLS PIN #73119095 Report a problem | ||
| 2/26/2021 | Sold | $810,000-10%$217/sqft |
Source: Public Record Report a problem | ||
| 11/8/2020 | Listed for sale | $899,900+113.1%$241/sqft |
Source: LAER Realty Partners #72754603 Report a problem | ||
| 12/3/2013 | Sold | $422,264-9.8%$113/sqft |
Source: Public Record Report a problem | ||
| 10/12/2005 | Sold | $468,000-1.5%$125/sqft |
Source: Public Record Report a problem | ||
| 5/26/2005 | Sold | $475,000+242%$127/sqft |
Source: Public Record Report a problem | ||
| 5/29/1998 | Sold | $138,900$37/sqft |
Source: Public Record Report a problem | ||
Public tax history
| Year | Property taxes | Tax assessment |
|---|---|---|
| 2025 | $10,979 -24.5% | $953,900 -21.9% |
| 2024 | $14,536 +4% | $1,221,500 +8.2% |
| 2023 | $13,971 -1.1% | $1,128,500 +5.8% |
| 2022 | $14,131 +3.9% | $1,066,500 +6.8% |
| 2021 | $13,601 -10.2% | $998,600 +95.5% |
| 2020 | $15,145 +128.9% | $510,700 +10% |
| 2019 | $6,615 +11.2% | $464,200 +10.1% |
| 2018 | $5,947 -6.8% | $421,800 +6.9% |
| 2017 | $6,383 +37.3% | $394,600 +21% |
| 2016 | $4,648 +15.1% | $326,200 +16.3% |
| 2015 | $4,038 +21.1% | $280,400 +18.8% |
| 2013 | $3,335 +4.9% | $236,000 +2.5% |
| 2012 | $3,179 +3.7% | $230,200 -3% |
| 2011 | $3,065 +6.9% | $237,200 |
| 2010 | $2,868 -28.2% | $237,200 -35.8% |
| 2009 | $3,993 -16% | $369,700 -22.6% |
| 2008 | $4,753 +7.3% | $477,700 +0.7% |
| 2007 | $4,428 +2.6% | $474,600 +5.7% |
| 2006 | $4,317 +7.7% | $448,800 +6.9% |
| 2005 | $4,007 +23.4% | $420,000 +20.1% |
| 2004 | $3,246 +21.7% | $349,800 +31.7% |
| 2003 | $2,667 +14.5% | $265,600 +65.5% |
| 2002 | $2,330 +42.2% | $160,500 +43.6% |
| 2000 | $1,638 | $111,800 |
Find assessor info on the county website
Monthly payment
Est. payment
Payment breakdown
Explore the cost of this home by adjusting the details. Changes won't be saved.Climate risks
Neighborhood: 02150


Similar homes
- $1,050,0008 bd3 ba3.1k sqft45 Addison St, Chelsea, MA 02150For Sale
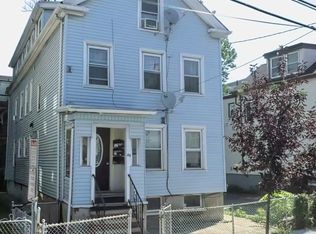 MLS ID #73592192, Erik Pali, Erik Pali. MLS PIN
- $850,0008 bd3 ba3.1k sqft31 Library St, Chelsea, MA 02150For Sale
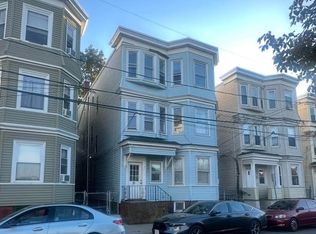 MLS ID #73594925, Team ROVI, Real Broker MA, LLC. MLS PIN
- $1,090,0006 bd5 ba3.4k sqft18 Suffolk St, Chelsea, MA 02150For Sale
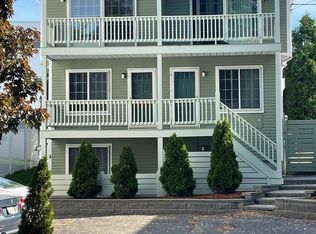 MLS ID #73576989, Ronald Mastrocola, Mastrocola Management, Inc.. MLS PIN
- $999,9997 bd4 ba3.4k sqft75 Harvard St, Chelsea, MA 02150For Sale
 MLS ID #73570977, Pricila Ray, Keller Williams Realty. MLS PIN
