Attention Investors. This oversized 2 bed (possible 4), 1 bath, 1,668 sqft. home is ready for it's next owner. Motivated seller and priced to sell. Buyer to verify all measurements and information prior to makeing an offer.
Pending
$65,000
1552 S Fountain Ave, Springfield, OH 45506
2beds
1,668sqft
Single Family Residence
Built in 1903
7,840 Square Feet Lot
$-- Zestimate®
$39/sqft
$-- HOA
What's special
- 4 days
- 125
- 8
Likely to sell faster than
Zillow last checked:
Listing updated:
Listed by:
Jeannie Fudge 937-322-0352,
Coldwell Banker Heritage,
Mark Kapp 937-322-0352,
Coldwell Banker Heritage
Source: WRIST,MLS#: 1049786
Facts & features
Interior
Bedrooms & bathrooms
- Bedrooms: 2
- Bathrooms: 1
- Full bathrooms: 1
Bedroom 1
- Level: Second
- Area: 100 Square Feet
- Dimensions: 10.00 x 10.00
Bedroom 2
- Level: Second
- Area: 160 Square Feet
- Dimensions: 10.00 x 16.00
Heating
- Forced Air, Natural Gas
Features
- Flooring: Carpet, Hardwood
- Basement: Full,Unfinished
- Number of fireplaces: 2
- Fireplace features: Inoperable, Two Fireplaces
Interior area
- Total structure area: 1,668
- Total interior livable area: 1,668 sqft
Video & virtual tour
Property
Features
- Levels: Two
- Stories: 2
- Patio & porch: Porch
Lot
- Size: 7,840 Square Feet
- Dimensions: 50 x 158
- Features: Residential Lot
Details
- Parcel number: 3400700033119001
- Zoning description: Residential
Construction
Type & style
- Home type: SingleFamily
- Architectural style: Other
- Property subtype: Single Family Residence
Materials
- Wood Siding
- Foundation: Other
Condition
- Year built: 1903
Utilities & green energy
- Sewer: Public Sewer
- Water: Supplied Water
- Utilities for property: Natural Gas Connected
Community & HOA
Community
- Subdivision: Highlands
HOA
- Has HOA: No
Location
- Region: Springfield
Financial & listing details
- Price per square foot: $39/sqft
- Tax assessed value: $58,700
- Annual tax amount: $914
- Date on market: 11/14/2026
- Listing terms: Cash
Estimated market value
Not available
Estimated sales range
Not available
$1,321/mo
Price history
| Date | Event | Price |
|---|---|---|
| 11/17/2026 | Pending sale | $65,000$39/sqft |
Source:  WRIST #1049786 Report a problem | ||
| 11/14/2026 | Listed for sale | $65,000+225%$39/sqft |
Source: WRIST #1049786 Report a problem | ||
| 4/3/2025 | Listing removed | $1,300$1/sqft |
Source: Zillow Rentals Report a problem | ||
| 3/6/2025 | Listed for rent | $1,300+79.3%$1/sqft |
Source: Zillow Rentals Report a problem | ||
| 3/2/2021 | Listing removed | -- |
Source: Zillow Rental Manager Report a problem | ||
| 2/23/2021 | Listed for rent | $725+21.8% |
Source: Zillow Rental Manager Report a problem | ||
| 2/16/2016 | Listing removed | $595 |
Source: ROOST Real Estate Co. Report a problem | ||
| 2/11/2016 | Listed for rent | $595 |
Source: ROOST Real Estate Co. Report a problem | ||
| 3/8/2007 | Sold | $20,000$12/sqft |
Source: Public Record Report a problem | ||
Public tax history
| Year | Property taxes | Tax assessment |
|---|---|---|
| 2025 | $914 +16.1% | $20,540 +32.2% |
| 2024 | $788 +2.6% | $15,540 |
| 2023 | $768 -2.4% | $15,540 |
| 2022 | $786 +18.5% | $15,540 +28.6% |
| 2021 | $664 -0.2% | $12,080 |
| 2020 | $665 -0.3% | $12,080 |
| 2019 | $667 -5% | $12,080 -1% |
| 2018 | $702 | $12,200 -19.1% |
| 2017 | $702 -0.1% | $15,075 |
| 2016 | $702 +96.2% | $15,075 +2.3% |
| 2015 | $358 | $14,732 |
| 2014 | $358 -49.2% | $14,732 |
| 2013 | $705 +4.2% | $14,732 +20.8% |
| 2012 | $677 -2% | $12,198 |
| 2011 | $691 +7.7% | $12,198 |
| 2010 | $642 -6.4% | $12,198 -12% |
| 2009 | $685 +3% | $13,861 |
| 2008 | $666 0% | $13,861 -1.2% |
| 2007 | $666 -15.4% | $14,036 -8.9% |
| 2006 | $786 +135.5% | $15,407 |
| 2005 | $334 -72% | $15,407 0% |
| 2004 | $1,194 +13% | $15,410 +15% |
| 2003 | $1,057 -0.2% | $13,400 |
| 2002 | $1,059 +19.3% | $13,400 +18% |
| 2000 | $887 | $11,360 |
Find assessor info on the county website
Monthly payment
Est. payment
Payment breakdown
Explore the cost of this home by adjusting the details. Changes won't be saved.Climate risks
Neighborhood: 45506
- $92,7203 bd1 ba1.4k sqft1554 S Fountain Ave, Springfield, OH 45506Off Market
- $74,9003 bd1 ba1.7k sqft1564 S Fountain Ave, Springfield, OH 45506Off Market
- $116,8003 bd1 ba1.6k sqft1514 S Fountain Ave, Springfield, OH 45506Off Market
- $79,7003 bd1 ba2k sqft1602 S Fountain Ave, Springfield, OH 45506Off Market
Similar homes
- $80,0002 bd1 ba1.5k sqft1825 S Yellow Springs St, Springfield, OH 45506For Sale
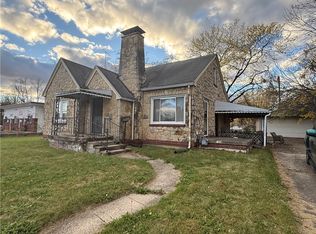
 MLS ID #973374, Sarah Lyons, Glasshouse Realty Group. DABR MLS
- $69,9005 bd2 ba1.9k sqft1602-1604 W High St, Springfield, OH 45506For Sale
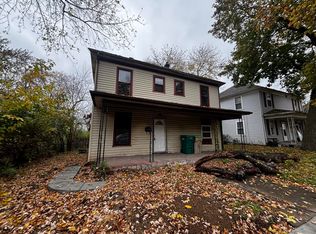
 MLS ID #1049758, Haley Lough, Coldwell Banker Heritage. WRIST
- $79,9003 bd2 ba1.4k sqft320 W Euclid Ave, Springfield, OH 45506For Sale
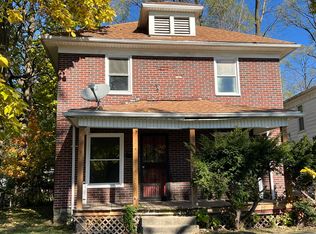 MLS ID #1049545, Tina Bleything, Roost Real Estate Co.. WRIST
- $79,9003 bd1 ba1.3k sqft1851 S Fountain Ave, Springfield, OH 45506For Sale
 MLS ID #1049556, Tina Bleything, Roost Real Estate Co.. WRIST
- $97,5003 bd2 ba2k sqft1627 Woodward Ave, Springfield, OH 45506For SaleMLS ID #1049088, Stephanie Dobler, Roost Real Estate Co.. WRIST
- $74,9004 bd2 ba2.1k sqft506 W Southern Ave, Springfield, OH 45506For Sale
 MLS ID #226026247, Yuliya O Kotova, OwnerLand Realty, Inc.. Columbus and Central Ohio Regional MLS
- $63,0002 bd1 ba1.2k sqft705 York St, Springfield, OH 45505For SaleMLS ID #1035301, Alva Fulk, Real Estate II, Inc.. WRIST
- $85,0003 bd1 ba1.4k sqft135 Wilson Ave, Springfield, OH 45505For SaleMLS ID #1049652, Tina Bleything, Roost Real Estate Co.. WRIST
- $71,0002 bd2 ba1k sqft910 Pine St, Springfield, OH 45505For SaleMLS ID #962892, Brandon Harris, Keller Williams Community Part. DABR MLS
- $89,0002 bd1 ba1.3k sqft1217 W Mulberry St, Springfield, OH 45506For SaleMLS ID #968545, Carie Park Chesser, Bella Realty Group. DABR MLS
- $75,0002 bd1 ba1.2k sqft151 Clay St, Urbana, OH 43078For SaleMLS ID #1049852, Cindy J. Randall, Koerner Realty. WRIST
- $45,0003 bd1 ba1.2k sqft1001 Clifton Ave, Springfield, OH 45505For SaleMLS ID #971474, Raul Etayem, Coldwell Banker Heritage. DABR MLS
- $79,9003 bd2 ba1.4k sqft1618 Highland Ave, Springfield, OH 45503For SaleMLS ID #970339, Kathy Cubbage, Lagonda Creek Real Estate LLC. DABR MLS
- $46,0002 bd1 ba1k sqft546 E Rose St, Springfield, OH 45505For SaleMLS ID #1048558, KD Nave, Glasshouse Realty Group. WRIST
- $75,0004 bd3 ba2.1k sqft7 W Mulberry St, Springfield, OH 45506For SaleMLS ID #960395, Arthur Solomon, Coldwell Banker Heritage. DABR MLS
- $79,9003 bd1 ba1.5k sqft1629 Lexington Ave, Springfield, OH 45505For SaleMLS ID #970725, Nathan Evans, Coldwell Banker Heritage. DABR MLS
- $47,0003 bd1 ba1.1k sqft1322 Linden Ave, Springfield, OH 45505For SaleMLS ID #966910, Sam Cooper, Howard Hanna Real Estate Serv. DABR MLS
- $79,9004 bd2 ba1.7k sqft1682 Edwards Ave, Springfield, OH 45503For SaleMLS ID #950960, Michele Hines, BHHS Professional Realty. DABR MLS
