Opportunity awaits at 1627 Woodward Avenue! This spacious 3-bedroom, 2-bath, two-story home offers plenty of potential for a complete renovation. Features include original woodwork, French doors, arched doorways, a fireplace, covered front porch, full basement, and rear deck. Situated on a 50 x 140 lot, this property is ready for someone with the vision to bring it back to life. Extensive repairs and updates are needed throughout. Property is being sold as-is.
Active
$97,500
1627 Woodward Ave, Springfield, OH 45506
3beds
2,016sqft
Single Family Residence
Built in 1915
6,969 Square Feet Lot
$-- Zestimate®
$48/sqft
$-- HOA
What's special
Rear deckCovered front porchOriginal woodworkFull basementArched doorwaysFrench doors
- 39 days
- 122
- 12
Zillow last checked:
Listing updated:
Listed by:
Stephanie Dobler 937-390-3715,
Roost Real Estate Co.
Source: WRIST,MLS#: 1049088
Facts & features
Interior
Bedrooms & bathrooms
- Bedrooms: 3
- Bathrooms: 2
- Full bathrooms: 2
Bedroom 1
- Level: Second
Bedroom 2
- Level: Second
Bedroom 3
- Level: Second
Bathroom 1
- Level: First
Bathroom 2
- Level: Second
Kitchen
- Level: First
Kitchen
- Level: Second
Living room
- Level: First
Study
- Level: First
Heating
- Natural Gas
Features
- Basement: Full,Unfinished
- Has fireplace: No
Interior area
- Total structure area: 2,016
- Total interior livable area: 2,016 sqft
Video & virtual tour
Property
Features
- Levels: Two
- Stories: 2
Lot
- Size: 6,969 Square Feet
- Dimensions: 50 x 140
- Features: Plat
Details
- Parcel number: 3400700033117023
Construction
Type & style
- Home type: SingleFamily
- Architectural style: American
- Property subtype: Single Family Residence
Materials
- Vinyl Siding
Condition
- Year built: 1915
Utilities & green energy
- Sewer: Public Sewer
- Water: Supplied Water
Community & HOA
Community
- Subdivision: Highlands Add
HOA
- Has HOA: No
Location
- Region: Springfield
Financial & listing details
- Price per square foot: $48/sqft
- Tax assessed value: $46,270
- Annual tax amount: $721
- Date on market: 10/13/2026
- Listing terms: Cash,Conventional,Other New Financing
Estimated market value
Not available
Estimated sales range
Not available
$1,674/mo
Price history
| Date | Event | Price |
|---|---|---|
| 10/13/2026 | Listed for sale | $97,500+30%$48/sqft |
Source:  WRIST #1049088 Report a problem | ||
| 4/8/2021 | Listing removed | -- |
Source: Zillow Rental Manager Report a problem | ||
| 4/6/2021 | Listed for rent | $800+15.1% |
Source: Zillow Rental Manager Report a problem | ||
| 3/24/2021 | Listing removed | -- |
Source: Owner Report a problem | ||
| 9/27/2018 | Listing removed | $695 |
Source: Owner Report a problem | ||
| 9/6/2018 | Price change | $695-7.3% |
Source: Owner Report a problem | ||
| 8/28/2018 | Listed for rent | $750+15.4% |
Source: Owner Report a problem | ||
| 4/13/2016 | Listing removed | $650+4% |
Source: Owner Report a problem | ||
| 8/16/2014 | Listing removed | $625 |
Source: Spartan Apartments, LLC Report a problem | ||
| 8/14/2014 | Listed for rent | $625 |
Source: Spartan Apartments, LLC Report a problem | ||
| 1/30/2007 | Sold | $75,000+459.8%$37/sqft |
Source: Public Record Report a problem | ||
| 11/9/2006 | Sold | $13,398-85.2%$7/sqft |
Source: Public Record Report a problem | ||
| 4/12/2001 | Sold | $90,700-0.3%$45/sqft |
Source: Public Record Report a problem | ||
| 3/31/2000 | Sold | $91,000+152.8%$45/sqft |
Source: Public Record Report a problem | ||
| 11/29/1995 | Sold | $36,000$18/sqft |
Source: Public Record Report a problem | ||
Public tax history
| Year | Property taxes | Tax assessment |
|---|---|---|
| 2025 | $721 +13.1% | $16,190 +28.8% |
| 2024 | $637 +2.6% | $12,570 |
| 2023 | $621 -2.4% | $12,570 |
| 2022 | $636 +65.4% | $12,570 +79.6% |
| 2021 | $385 -0.2% | $7,000 |
| 2020 | $386 -27.9% | $7,000 -27.8% |
| 2019 | $535 +342.9% | $9,690 +130.7% |
| 2018 | $121 | $4,200 -69.7% |
| 2017 | $121 -69.7% | $13,874 |
| 2016 | $399 +233.2% | $13,874 +2.4% |
| 2015 | $120 | $13,552 |
| 2014 | $120 -49.3% | $13,552 |
| 2013 | $236 -61.5% | $13,552 +19.1% |
| 2012 | $614 -2% | $11,376 |
| 2011 | $626 +4.7% | $11,376 |
| 2010 | $598 +6.7% | $11,376 -12% |
| 2009 | $560 -9.7% | $12,930 |
| 2008 | $621 +1.3% | $12,930 |
| 2007 | $613 -9.7% | $12,930 -54.1% |
| 2006 | $679 -45.5% | $28,158 +2.1% |
| 2005 | $1,247 -41.9% | $27,591 -4.1% |
| 2004 | $2,145 +8.7% | $28,780 +15% |
| 2003 | $1,973 -0.2% | $25,020 |
| 2002 | $1,977 +55.5% | $25,020 +53.7% |
| 2000 | $1,271 | $16,280 |
Find assessor info on the county website
Monthly payment
Est. payment
Payment breakdown
Explore the cost of this home by adjusting the details. Changes won't be saved.Climate risks
Neighborhood: 45506


Similar homes
- $115,0003 bd1 ba1.4k sqft1635 S Center Blvd, Springfield, OH 45506For Sale
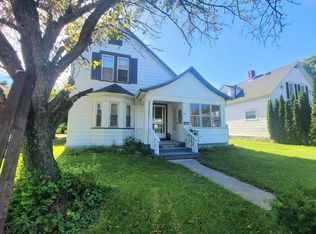
 MLS ID #1048908, Colton Risk, Howard Hanna Real Estate Services. WRIST
- $100,0004 bd2 ba1.8k sqft207 S Shaffer St, Springfield, OH 45506For Sale
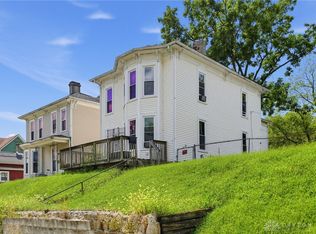
 MLS ID #968713, Scott Fader, Joseph Walter Realty, LLC. DABR MLS
- $79,9003 bd1 ba1.3k sqft1851 S Fountain Ave, Springfield, OH 45506For Sale
 MLS ID #1049556, Tina Bleything, Roost Real Estate Co.. WRIST
- $79,9003 bd2 ba1.4k sqft320 W Euclid Ave, Springfield, OH 45506For Sale
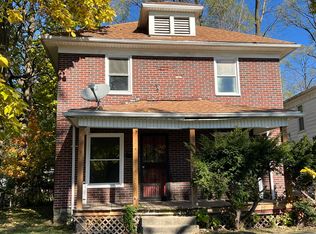 MLS ID #1049545, Tina Bleything, Roost Real Estate Co.. WRIST
- $80,0002 bd1 ba1.5k sqft1825 S Yellow Springs St, Springfield, OH 45506For SaleMLS ID #973374, Sarah Lyons, Glasshouse Realty Group. DABR MLS
- $85,0003 bd1 ba1.4k sqft135 Wilson Ave, Springfield, OH 45505For SaleMLS ID #1049652, Tina Bleything, Roost Real Estate Co.. WRIST
- $95,0004 bd2 ba2.2k sqft657 W Jefferson St, Springfield, OH 45506For SaleMLS ID #967127, Virginia Bystrek, Howard Hanna Real Estate Serv. DABR MLS
- $99,9003 bd2 ba1.1k sqft550 E Rose St, Springfield, OH 45505For SaleMLS ID #928210, Alva L Fulk, Real Estate II Inc.. DABR MLS
- $114,9002 bd1 ba1.1k sqft1837 S Fountain Ave, Springfield, OH 45506For SaleMLS ID #966800, Virginia Bystrek, Howard Hanna Real Estate Serv. DABR MLS
- $119,0002 bd1 ba1k sqft1628 Woodward Ave, Springfield, OH 45506For SaleMLS ID #1047948, Anna Catanzaro, Glasshouse Realty Group. WRIST
- $125,0003 bd2 ba1.8k sqft1761 Edwards Ave, Springfield, OH 45503For SaleMLS ID #1049820, Tina Benton, Sibcy Cline, Inc.. WRIST
- $89,0002 bd1 ba1.3k sqft1217 W Mulberry St, Springfield, OH 45506For SaleMLS ID #968545, Carie Park Chesser, Bella Realty Group. DABR MLS
- $74,9004 bd2 ba2.1k sqft506 W Southern Ave, Springfield, OH 45506For Sale
 MLS ID #226026247, Yuliya O Kotova, OwnerLand Realty, Inc.. Columbus and Central Ohio Regional MLS
- $100,0005 bd2 ba1.9k sqft227 E Northern Ave, Springfield, OH 45503For SaleMLS ID #1047694, Cecilia Hill, Coldwell Banker Heritage. WRIST
- $100,0003 bd1 ba1.3k sqft240 E McCreight Ave, Springfield, OH 45503For SaleMLS ID #957821, Jeff Horne, Coldwell Banker Heritage. DABR MLS
- $105,0003 bd1 ba1.2k sqft2210 Larch St, Springfield, OH 45503For SaleMLS ID #971056, Jackson Taulbee, Keller Williams Community Part. DABR MLS
- $135,9003 bd1 ba1.2k sqft728 Innisfallen Ave, Springfield, OH 45506For SaleMLS ID #972099, Heather Bacon, Gallery Homes Real Estate, LLC. DABR MLS
- $110,0006 bd2 ba2.7k sqft709-711 W Mulberry St, Springfield, OH 45506For SaleMLS ID #953198, Marcus Raffat, Bella Realty Group. DABR MLS
- $79,9003 bd2 ba1.4k sqft1618 Highland Ave, Springfield, OH 45503For SaleMLS ID #970339, Kathy Cubbage, Lagonda Creek Real Estate LLC. DABR MLS
