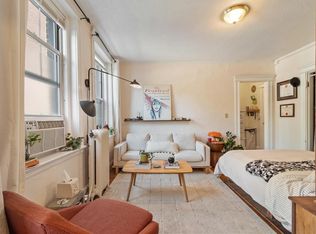
Prime Southie location just a block from West Broadway! This updated condo makes every square foot count with a smart, functional layout. A separate sleeping alcove comfortably fits a queen bed, offering the privacy and sense of space that's rare in a studio, while three generous closets provide plenty of storage. Recent 2026 updates include a new boiler, refrigerator, and range, so the big-ticket items are already taken care of. Set in a classic brick building with professional management and low condo fees, this is an excellent opportunity for first-time buyers to break into Boston's competitive market and an equally smart pick for investors. Brick St Bagels, Dalia, and Blank St Coffee are right at your doorstep, with grocery stores, fitness studios, green spaces, and the Red Line all close by. Move-in ready and waiting for its new owner!
For sale
$359,000
166 F St APT 1, South Boston, MA 02127
0beds
382sqft
Condominium
Built in 1890
-- sqft lot
$338,100 Zestimate®
$940/sqft
$210/mo HOA
What's special
New boilerSmart functional layoutClassic brick buildingUpdated condo
- 5 hours
- 28
- 0
Zillow last checked:
Listing updated:
Listed by:
Nicole Yoshikane 617-756-0830,
Keller Williams Realty Boston-Metro | Back Bay 617-542-0012
Source: MLS PIN,MLS#: 73598796
Facts & features
Interior
Bedrooms & bathrooms
- Bedrooms: 0
- Bathrooms: 1
- Full bathrooms: 1
Heating
- Baseboard
Cooling
- None
Appliances
- Included: Range, Disposal, Microwave
- Laundry: Off-Site
Features
- Flooring: Vinyl
- Has basement: No
- Has fireplace: No
Interior area
- Total structure area: 382
- Total interior livable area: 382 sqft
- Finished area above ground: 382
Property
Parking
- Parking features: On Street
- Has uncovered spaces: Yes
Details
- Parcel number: 1414946
- Zoning: res
Construction
Type & style
- Home type: Condo
- Property subtype: Condominium
Materials
- Frame
Condition
- Year built: 1890
Utilities & green energy
- Sewer: Public Sewer
- Water: Public
Community & HOA
Community
- Features: Public Transportation, Shopping, Highway Access
HOA
- Services included: Water, Sewer, Insurance, Snow Removal
- HOA fee: $210 monthly
Location
- Region: South Boston
Financial & listing details
- Price per square foot: $940/sqft
- Tax assessed value: $285,300
- Annual tax amount: $3,538
- Date on market: 11/12/2026
Estimated market value
$338,100
$308,000 - $369,000
$2,697/mo
Price history
| Date | Event | Price |
|---|---|---|
| 11/12/2026 | Listed for sale | $359,000+5.6%$940/sqft |
Source: MLS PIN #73598796 Report a problem | ||
| 7/6/2026 | Listing removed | $2,300$6/sqft |
Source: MLS PIN #73542518 Report a problem | ||
| 6/26/2026 | Listed for rent | $2,300+4.5%$6/sqft |
Source: MLS PIN #73542518 Report a problem | ||
| 12/29/2025 | Listing removed | $2,200$6/sqft |
Source: MLS PIN #73462754 Report a problem | ||
| 12/17/2025 | Listed for rent | $2,200+18.9%$6/sqft |
Source: MLS PIN #73462754 Report a problem | ||
| 12/12/2025 | Sold | $340,000+3%$890/sqft |
Source: MLS PIN #73446655 Report a problem | ||
| 11/11/2025 | Contingent | $330,000$864/sqft |
Source: MLS PIN #73446655 Report a problem | ||
| 10/22/2025 | Listed for sale | $330,000+20%$864/sqft |
Source: MLS PIN #73446655 Report a problem | ||
| 12/19/2018 | Listing removed | $1,850$5/sqft |
Source: Joyce Lebedew Real Estate Report a problem | ||
| 11/9/2018 | Price change | $1,850-5.1%$5/sqft |
Source: Joyce Lebedew Real Estate #72413883 Report a problem | ||
| 10/24/2018 | Listed for rent | $1,950+8.3%$5/sqft |
Source: Joyce Lebedew Real Estate #72413883 Report a problem | ||
| 2/2/2016 | Listing removed | $1,800$5/sqft |
Source: Joyce Lebedew Real Estate, LLC #71952349 Report a problem | ||
| 1/27/2016 | Listed for rent | $1,800$5/sqft |
Source: Joyce Lebedew Real Estate, LLC #71952349 Report a problem | ||
| 3/31/2014 | Sold | $275,000$720/sqft |
Source: Agent Provided Report a problem | ||
Public tax history
| Year | Property taxes | Tax assessment |
|---|---|---|
| 2025 | $3,304 -7.6% | $285,300 -13% |
| 2024 | $3,575 +4.5% | $328,000 +3% |
| 2023 | $3,420 +1.7% | $318,400 +3% |
| 2022 | $3,363 +2% | $309,100 |
| 2021 | $3,298 +36.4% | $309,100 +35% |
| 2020 | $2,418 +8.1% | $229,000 +8% |
| 2019 | $2,236 +6.6% | $212,100 +6% |
| 2018 | $2,097 +332.3% | $200,100 +8% |
| 2017 | $485 -75% | $185,300 +5% |
| 2016 | $1,940 -1.5% | $176,400 +8.5% |
| 2015 | $1,969 +11.5% | $162,600 +21% |
| 2013 | $1,766 -3.7% | $134,400 -4.4% |
| 2012 | $1,833 +1.9% | $140,600 |
| 2011 | $1,798 +7.7% | $140,600 |
| 2010 | $1,670 +13.4% | $140,600 +1.4% |
| 2009 | $1,473 -3.1% | $138,600 |
| 2008 | $1,520 -4.4% | $138,600 -4.2% |
| 2007 | $1,590 | $144,700 |
Find assessor info on the county website
Monthly payment
Est. payment
Payment breakdown
Explore the cost of this home by adjusting the details. Changes won't be saved.Climate risks
Neighborhood: South Boston


Similar homes
- $499,9001 bd1 ba484 sqft683 E 2nd St #1, South Boston, MA 02127For Sale
 MLS ID #73599226, Mimi Henning, Barrett Sotheby's International Realty. MLS PIN
- $475,0001 bd1 ba554 sqft11 Boston St #2, South Boston, MA 02127For Sale
 MLS ID #73599147, Julian Addy, William Raveis R.E. & Home Services. MLS PIN
- $479,0001 bd1 ba532 sqft549 E 4th St APT D5, South Boston, MA 02127For Sale
 MLS ID #73562569, Chris Lydon, William Raveis R.E. & Home Services. MLS PIN
- $399,000-- bd1 ba386 sqftRiverway Square Condominiums, Boston, MA 02215For Sale
 MLS ID #73598702, Elizabeth Mason, Longwood Residential, LLC. MLS PIN
