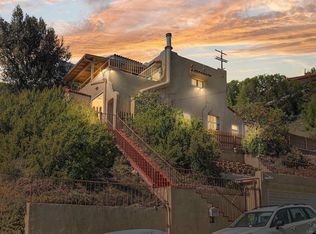
South Mission Hills custom 3 Bedrooms 2 1/2 Baths with amazing ocean views.
For sale
Listed by: EXCLUSIVE REALTY ASSOCIATES • FRANK LUCERO • 213-500-8999
Est. $1,700,000
1663 Puterbaugh St, San Diego, CA 92103
3beds
1,542sqft
Single Family Residence
Built in 1940
3,999 Square Feet Lot
$1,660,800 Zestimate®
$1,102/sqft
$-- HOA
Overview
- 10 days
- 187
- 16
Zillow last checked:
Listing updated:
Listed by:
FRANK LUCERO DRE #01737608 213-500-8999,
EXCLUSIVE REALTY ASSOCIATES
Source: CRMLS,MLS#: MB26232462 Originating MLS: California Regional MLS
Facts & features
Interior
Bedrooms & bathrooms
- Bedrooms: 3
- Bathrooms: 3
- Full bathrooms: 2
- 1/2 bathrooms: 1
- Main level bathrooms: 2
- Main level bedrooms: 3
Rooms
- Room types: Bedroom
Bedroom
- Features: All Bedrooms Up
Cooling
- Central Air
Appliances
- Laundry: Inside
Features
- All Bedrooms Up
- Has fireplace: No
- Fireplace features: None
- Common walls with other units/homes: No Common Walls
Interior area
- Total interior livable area: 1,542 sqft
Property
Parking
- Total spaces: 1
- Parking features: Garage - Attached
- Attached garage spaces: 1
Features
- Levels: Two
- Stories: 2
- Entry location: 1
- Pool features: None
- Has view: Yes
- View description: Ocean
- Has water view: Yes
- Water view: Ocean
Lot
- Size: 3,999 Square Feet
- Features: 0-1 Unit/Acre
Details
- Parcel number: 4512210400
- Special conditions: Notice Of Default,Short Sale
Construction
Type & style
- Home type: SingleFamily
- Property subtype: Single Family Residence
Condition
- New construction: No
- Year built: 1940
Utilities & green energy
- Sewer: Public Sewer
- Water: Public
Community & HOA
Community
- Features: Curbs, Street Lights
- Subdivision: Mission Hills
Location
- Region: San Diego
Financial & listing details
- Price per square foot: $1,102/sqft
- Tax assessed value: $1,643,000
- Date on market: 10/29/2026
- Cumulative days on market: 10 days
- Listing terms: Cash,Conventional
Foreclosure details
Estimated market value
$1,660,800
$1.58M - $1.74M
$4,965/mo
Price history
| Date | Event | Price |
|---|---|---|
| 11/21/2025 | Sold | $1,643,000+9.5%$1,065/sqft |
Source: Public Record Report a problem | ||
| 8/6/2025 | Listing removed | $1,500,000$973/sqft |
Source:  SDMLS #250021415 Report a problem | ||
| 7/25/2025 | Price change | $1,500,000-1.6%$973/sqft |
Source: SDMLS #250021415 Report a problem | ||
| 6/27/2025 | Pending sale | $1,525,000$989/sqft |
Source: SDMLS #250021415 Report a problem | ||
| 6/19/2025 | Price change | $1,525,000-3.2%$989/sqft |
Source: SDMLS #250021415 Report a problem | ||
| 4/29/2025 | Price change | $1,575,000-1.3%$1,021/sqft |
Source: SDMLS #250021415 Report a problem | ||
| 3/29/2025 | Price change | $1,595,000-3.3%$1,034/sqft |
Source: SDMLS #250021415 Report a problem | ||
| 1/16/2025 | Listed for sale | $1,650,000+47.3%$1,070/sqft |
Source: SDMLS #250001332 Report a problem | ||
| 8/19/2024 | Sold | $1,120,000$726/sqft |
Source: Public Record Report a problem | ||
Public tax history
| Year | Property taxes | Tax assessment |
|---|---|---|
| 2026 | -- | $1,643,000 +46.7% |
| 2025 | $14,573 -15.9% | $1,120,000 -20.4% |
| 2024 | $17,321 +1473.8% | $1,407,600 +1395.9% |
| 2023 | $1,101 +2.9% | $94,096 +2% |
| 2022 | $1,070 +0.8% | $92,252 +2% |
| 2021 | $1,061 +1.3% | $90,444 +1% |
| 2020 | $1,048 +5.3% | $89,518 +2% |
| 2019 | $995 +3.5% | $87,763 +2% |
| 2018 | $961 +2.6% | $86,043 +2% |
| 2017 | $936 +1.9% | $84,357 +2% |
| 2016 | $919 +1.6% | $82,704 +1.5% |
| 2015 | $904 +1.6% | $81,463 +2% |
| 2014 | $889 | $79,868 +0.5% |
| 2013 | -- | $79,508 +2% |
| 2012 | -- | $77,950 +2% |
| 2011 | -- | $76,422 +0.8% |
| 2010 | -- | $75,852 -0.2% |
| 2009 | -- | $76,033 +2% |
| 2008 | -- | $74,543 +2% |
| 2007 | -- | $73,082 +2% |
| 2006 | -- | $71,650 +2% |
| 2005 | -- | $70,246 +2% |
| 2004 | -- | $68,870 +1.9% |
| 2003 | -- | $67,609 +2% |
| 2002 | -- | $66,284 +2% |
| 2001 | -- | $64,985 |
Find assessor info on the county website
Monthly payment
Est. payment
Payment breakdown
Explore the cost of this home by adjusting the details. Changes won't be saved.Climate risks
Neighborhood: Midtown
Similar homes
- $1,395,0003 bd2 ba1.4k sqft1594 Linwood St, San Diego, CA 92103For Sale
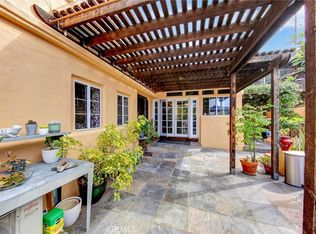 MLS ID #OC26157563, Jodie Moncrief, 888 Realty. CRMLS
- $1,399,0002 bd2 ba1.1k sqft912 Bush St, San Diego, CA 92103For Sale
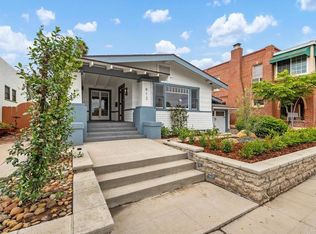 MLS ID #NDP2609310, James Jam, Berkshire Hathaway HomeService. CRMLS
- $1,624,9004 bd2 ba1.5k sqft5478 Honors Dr, San Diego, CA 92122For Sale
 MLS ID #260025841, Paul Burke, eXp Realty of Southern CA. SDMLS
- $1,175,0003 bd3 ba1.8k sqft3711 Columbia St, San Diego, CA 92103For Sale
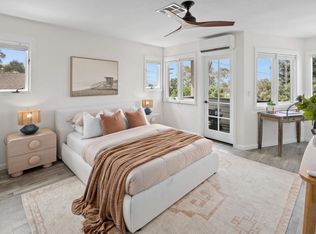 MLS ID #NDP2604804, Bobby Graham, Personalized RE. CRMLS
