ATTENTION INVESTORS! $92,340 IN ANNUAL GROSS RENTAL INCOME IN THE HEART OF LITTLE HAVANA! Exceptional income-producing investment opportunity. Perfect for investors seeking immediate cash flow, portfolio expansion, and long-term appreciation potential. This versatile multi-unit property also offers an attractive opportunity for owner-occupants to live in one unit while collecting rental income from the others. Explore additional revenue potential through short-term rentals, subject to applicable regulations, permits, and approvals. PRIME MIAMI LOCATION! Conveniently situated minutes from Brickell, Downtown Miami, Coral Gables, and Miami Beach, with easy access to major highways, dining, shopping, and entertainment. Whether you're a seasoned investor or a buyer looking to combine homeownership with rental income, this property offers flexibility and outstanding investment potential. INCOME TODAY, POTENTIAL FOR TOMORROW! DON'T MISS OUT SCHEDULE YOUR SHOWING TODAY! See Broker Remarks for important property information. Buyer and Buyer's Agent to verify rental income, unit configurations, permitted uses, and applicable regulations. SEE BROKER REMARKS FOR IMPORTANT INFORMATION!
For sale
Price cut: $96K (11/10)
$1,599,000
1664 SW 9th St, Miami, FL 33135
--beds
--baths
3,287sqft
Triplex
Built in 1923
-- sqft lot
$-- Zestimate®
$486/sqft
$-- HOA
What's special
- 29 days
- 159
- 5
Zillow last checked:
Listing updated:
Listed by:
Danay Puebla Llanos 305-338-6436,
Landan Realty LLC
Source: MIAMI,MLS#: A12105762 Originating MLS: A-Miami Association of REALTORS
Facts & features
Interior
Heating
- Central, Window/Wall
Cooling
- Ceiling Fan(s), Central Air, Wall/Window Unit(s)
Features
- Flooring: Marble, Tile
Interior area
- Total structure area: 3,287
- Total interior livable area: 3,287 sqft
Video & virtual tour
Property
Parking
- Total spaces: 5
Features
- Stories: 2
Lot
- Features: Less Than 1/4 Acre Lot
Details
- Parcel number: 0141100630421
- Zoning: 5700
Construction
Type & style
- Home type: MultiFamily
- Property subtype: Triplex
Materials
- CBS Construction
- Roof: Flat Tile,Shingle
Condition
- Year built: 1923
Utilities & green energy
- Sewer: Public Sewer
Community & HOA
Community
- Subdivision: Shenandoah
HOA
- Has HOA: No
Location
- Region: Miami
Financial & listing details
- Price per square foot: $486/sqft
- Tax assessed value: $772,650
- Annual tax amount: $9,002
- Date on market: 10/12/2026
- Listing terms: All Cash,Conventional,FHA
Estimated market value
Not available
Estimated sales range
Not available
Not available
Price history
| Date | Event | Price |
|---|---|---|
| 11/10/2026 | Price change | $1,599,000-5.7%$486/sqft |
Source:  MIAMI #A12105762 Report a problem | ||
| 10/13/2026 | Listed for sale | $1,695,000+13%$516/sqft |
Source: MIAMI #A12105762 Report a problem | ||
| 2/6/2026 | Listing removed | $1,500,000$456/sqft |
Source: MIAMI #A11779492 Report a problem | ||
| 12/8/2025 | Pending sale | $1,500,000$456/sqft |
Source: MIAMI #A11779492 Report a problem | ||
| 11/1/2025 | Price change | $1,500,000+16.3%$456/sqft |
Source: MIAMI #A11779492 Report a problem | ||
| 10/30/2025 | Price change | $1,290,000-19.1%$392/sqft |
Source: MIAMI #A11779492 Report a problem | ||
| 7/27/2025 | Pending sale | $1,595,000$485/sqft |
Source: MIAMI #A11779492 Report a problem | ||
| 6/4/2025 | Listed for sale | $1,595,000+77.2%$485/sqft |
Source: MIAMI #A11779492 Report a problem | ||
| 4/9/2025 | Sold | $900,000-35.5%$274/sqft |
Source: Public Record Report a problem | ||
| 4/9/2025 | Listed for sale | $1,395,000+102.2%$424/sqft |
Source: MIAMI #A11779492 Report a problem | ||
| 8/2/2021 | Sold | $690,000-2.8%$210/sqft |
Source: MIAMI #A11076842 Report a problem | ||
| 7/30/2021 | Pending sale | $710,000-4.7%$216/sqft |
Source: MIAMI #A11076842 Report a problem | ||
| 4/6/2021 | Listing removed | -- |
Source: MIAMI #A10999097 Report a problem | ||
| 3/24/2021 | Price change | $744,900-0.5%$227/sqft |
Source: MIAMI #A10999097 Report a problem | ||
| 3/16/2021 | Price change | $749,000-10.7%$228/sqft |
Source: MIAMI #A10999097 Report a problem | ||
| 2/24/2021 | Price change | $839,000-6.7%$255/sqft |
Source: MIAMI #A10999097 Report a problem | ||
| 2/16/2021 | Listed for sale | $899,000+19.9%$274/sqft |
Source: MIAMI #A10999097 Report a problem | ||
| 10/7/2020 | Sold | $750,000+36.4%$228/sqft |
Source: Public Record Report a problem | ||
| 12/16/2019 | Sold | $550,000$167/sqft |
Source: Public Record Report a problem | ||
Public tax history
| Year | Property taxes | Tax assessment |
|---|---|---|
| 2025 | $9,002 +2.7% | $472,129 +2.9% |
| 2024 | $8,761 +0.9% | $458,824 +3% |
| 2023 | $8,679 +1.9% | $445,461 +3% |
| 2022 | $8,516 -7.9% | $432,487 +13.3% |
| 2021 | $9,247 -0.3% | $381,588 -0.1% |
| 2020 | $9,275 +82% | $381,975 +79% |
| 2019 | $5,097 +9% | $213,432 +6.7% |
| 2018 | $4,676 | $200,106 +6.6% |
| 2017 | $4,676 +4.9% | $187,719 +6.5% |
| 2016 | $4,458 +13.4% | $176,339 +5.6% |
| 2015 | $3,931 +0.1% | $166,955 +1.7% |
| 2014 | $3,927 -21.1% | $164,096 +5.3% |
| 2013 | $4,980 | $155,794 -26.2% |
| 2012 | $4,980 -22.9% | $211,107 -19.2% |
| 2010 | $6,460 -10.6% | $261,251 -15.1% |
| 2009 | $7,222 -4% | $307,805 +4.1% |
| 2007 | $7,525 +27.8% | $295,666 |
| 2006 | $5,887 | -- |
| 2005 | $5,887 +16.2% | -- |
| 2004 | $5,068 +19.1% | -- |
| 2003 | $4,257 +6.8% | -- |
| 2001 | $3,986 | -- |
Find assessor info on the county website
Monthly payment
Est. payment
Payment breakdown
Explore the cost of this home by adjusting the details. Changes won't be saved.Climate risks
Neighborhood: Shenandoah

Similar homes
- $1,750,0005 bd5 ba2.6k sqftShenandoah, Miami, FL 33135For Sale
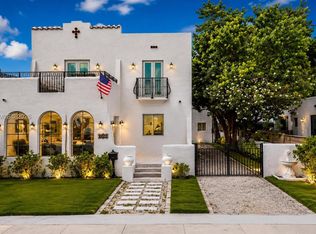
 MLS ID #A12051445, Albert Garcia, Miami Luxury Properties. MIAMI
- $1,349,0006 bd4 ba2k sqftShenandoah, Miami, FL 33135For Sale
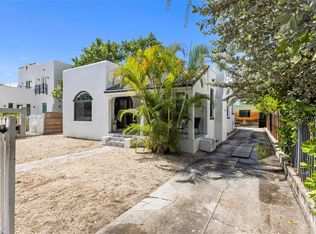 MLS ID #A12061110, Mario Kroeff, Douglas Elliman. MIAMI
- $1,625,0006 bd4 ba3.8k sqftBird Road Area, Miami, FL 33165For Sale
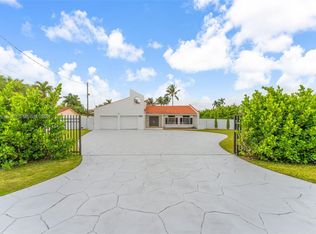 MLS ID #A12112618, Gustavo Pagoaga, Florida Realty of Miami Corp. MIAMI
- $1,399,0006 bd4 ba2.1k sqftFrow Homestead, Miami, FL 33133For Sale
 MLS ID #A12082353, Jason Smith, Keller Williams Capital Realty. MIAMI
- $1,195,0006 bd4 ba2.3k sqftValentine Villas, Miami, FL 33125For SaleMLS ID #A12104171, Mario Cabrera Benjamin Jr, Chez Realty, LLC.. MIAMI
- $1,088,000-- bd-- ba3.1k sqftGrapeland, Miami, FL 33145For SaleMLS ID #A12113181, Margarita Elordi, Core International Realty. MIAMI
- $1,670,0004 bd3 ba1.9k sqftMiami Shores Estates, Miami Shores, FL 33138For SaleMLS ID #A12118729, Lorenz Boulos, Colfax Realty International Inc. MIAMI
- $1,595,0005 bd3 ba3k sqftTall Woods, Miami, FL 33176For SaleMLS ID #A12071918, Mayra Fuentes, First Service Realty ERA. MIAMI
- $1,790,0004 bd3 ba2.1k sqftCoconut Gr Sec 1 C Gab, Coral Gables, FL 33134For SaleMLS ID #A12113085, Ricky Kallabat PA, Keller Williams Capital Realty. MIAMI
- $1,175,0003 bd4 ba1.6k sqftSilver Crest, Miami, FL 33145For SaleMLS ID #A12107364, Regla Cantera PA, Interinvestments Realty, Inc.. MIAMI
- $1,399,9174 bd3 ba2.9k sqftCoral Way Estates, Miami, FL 33175For SaleMLS ID #A12107529, Angelica Baez Baez, Angelica M Baez Real Estate Brokerage LLC. MIAMI
- $1,635,0005 bd3 ba2.5k sqftGallo-Wood Estates, Miami, FL 33156For SaleMLS ID #A12024580, Martha Medina, White Canvas Real Estate, LLC.. MIAMI
- $1,350,0004 bd3 ba2.4k sqftRoyal Palm Villas, South Miami, FL 33143For SaleMLS ID #A12116401, Lauren Allan, Compass Florida, LLC. MIAMI
- $1,600,0004 bd4 ba3.7k sqftCutler Heights Estates, Palmetto Bay, FL 33157For SaleMLS ID #A12051797, Lauren Margerison, Keller Williams Capital Realty. MIAMI
- $1,798,0003 bd3 ba2.4k sqftCoral Gables Sec B, Coral Gables, FL 33134For SaleMLS ID #A12046460, Belinda Sime, Sime Realty Corporation. MIAMI
- $1,995,0003 bd3 ba2.4k sqftItabuna Condo, Miami, FL 33133For SaleMLS ID #A12100367, Enid Escribano, Levine Realty, Inc.. MIAMI
- $1,700,0005 bd5 ba3.7k sqftElias Sub, Miami, FL 33176For SaleMLS ID #A12021859, Carlos Rivero, Xcellence. MIAMI
- $1,699,0003 bd2 ba1.7k sqftCoral Gables Country Club, Coral Gables, FL 33134For SaleMLS ID #A12046252, Paula Barrera, BHHS EWM Realty. MIAMI
- $1,369,0004 bd2 ba2.4k sqftRanchero Manors 1st & 2nd, Miami, FL 33176For SaleMLS ID #A12115263, Alireza Khakpour, Vision Realty LLC. MIAMI
- $1,250,0002 bd2 ba2.1k sqftBiscayne Park Kings Resub, Biscayne Park, FL 33161For SaleMLS ID #A12119427, Wesley Pearce, Graber Realty Group LLC. MIAMI
