Don't miss this great opportunity to own a cozy 2-bedroom, 1-bath home featuring a detached one-car garage and a spacious lot. Recent updates include the kitchen appliances, bathroom, hvac, flooring and more. Conveniently located just minutes from the interstate, shopping, and local amenities, this property is full of potential and ready for its next owner. Book your showing today.
Active
Price cut: $5K (11/10)
$245,000
1709 N Liberty Hill Rd, Morristown, TN 37814
2beds
750sqft
Single Family Residence
Built in 1956
0.39 Acres Lot
$-- Zestimate®
$327/sqft
$-- HOA
What's special
Detached one-car garageSpacious lot
- 23 days
- 308
- 45
Zillow last checked:
Listing updated:
Listed by:
Eldon Davis 865-279-4186,
United Real Estate Solutions 865-444-2400
Source: East Tennessee Realtors,MLS#: 1359416
Facts & features
Interior
Bedrooms & bathrooms
- Bedrooms: 2
- Bathrooms: 1
- Full bathrooms: 1
Heating
- Central
Cooling
- Central Air
Appliances
- Included: Dishwasher, Range, Refrigerator
Features
- Eat-in Kitchen
- Flooring: Hardwood
- Basement: Crawl Space
- Has fireplace: No
- Fireplace features: None
Interior area
- Total structure area: 750
- Total interior livable area: 750 sqft
Property
Parking
- Total spaces: 2
- Parking features: Detached
- Garage spaces: 2
Features
- Has view: Yes
- View description: Other, City
Lot
- Size: 0.39 Acres
- Features: Other
Details
- Parcel number: 025J D 01000 000
Construction
Type & style
- Home type: SingleFamily
- Architectural style: Traditional
- Property subtype: Single Family Residence
Materials
- Vinyl Siding, Frame
Condition
- Year built: 1956
Utilities & green energy
- Sewer: Public Sewer
- Water: Public
Community & HOA
Location
- Region: Morristown
Financial & listing details
- Price per square foot: $327/sqft
- Tax assessed value: $144,900
- Annual tax amount: $816
- Date on market: 10/19/2026
Estimated market value
Not available
Estimated sales range
Not available
Not available
Price history
| Date | Event | Price |
|---|---|---|
| 11/10/2026 | Price change | $245,000-2%$327/sqft |
Source:  East Tennessee Realtors #1359416 Report a problem | ||
| 10/19/2026 | Listed for sale | $250,000+94.2%$333/sqft |
Source: East Tennessee Realtors #1359416 Report a problem | ||
| 7/31/2026 | Sold | $128,750+0%$172/sqft |
Source: Public Record Report a problem | ||
| 5/26/2026 | Sold | $128,710-35.6%$172/sqft |
Source: Public Record Report a problem | ||
| 7/22/2024 | Sold | $200,000+1%$267/sqft |
Source: East Tennessee Realtors #1255652 Report a problem | ||
| 6/11/2024 | Pending sale | $197,999$264/sqft |
Source: East Tennessee Realtors #1255652 Report a problem | ||
| 6/2/2024 | Price change | $197,9990%$264/sqft |
Source:  Lakeway Area AOR #703325 Report a problem | ||
| 4/30/2024 | Price change | $198,000-5.3%$264/sqft |
Source: Lakeway Area AOR #703325 Report a problem | ||
| 4/15/2024 | Listed for sale | $209,000$279/sqft |
Source: East Tennessee Realtors #1255652 Report a problem | ||
| 3/15/2024 | Pending sale | $209,000$279/sqft |
Source: East Tennessee Realtors #1255652 Report a problem | ||
| 3/13/2024 | Listed for sale | $209,000+124.7%$279/sqft |
Source: East Tennessee Realtors #1255652 Report a problem | ||
| 11/1/2022 | Sold | $93,000$124/sqft |
Source: Public Record Report a problem | ||
Public tax history
| Year | Property taxes | Tax assessment |
|---|---|---|
| 2025 | $816 +79% | $36,225 +151.1% |
| 2024 | $456 | $14,425 |
| 2023 | $456 | $14,425 |
| 2022 | $456 | $14,425 |
| 2021 | $456 +0.1% | $14,425 |
| 2020 | $455 +0.9% | $14,425 +8.7% |
| 2019 | $451 +7.9% | $13,275 |
| 2018 | $418 +92.7% | $13,275 |
| 2017 | $217 | $13,275 |
| 2016 | $217 -40.6% | $13,275 |
| 2015 | $366 | $13,275 |
| 2014 | -- | $13,275 -3.8% |
| 2013 | -- | $13,800 |
| 2011 | $371 | $13,800 |
| 2010 | $371 | $13,800 |
| 2009 | -- | $13,800 +23.2% |
| 2008 | $354 -4.5% | $11,200 |
| 2007 | $371 +17.8% | $11,200 |
| 2006 | $315 | $11,200 |
| 2005 | $315 -10.8% | $11,200 |
| 2004 | $353 +11.4% | $11,200 +11.4% |
| 2003 | $317 | $10,050 0% |
| 2001 | -- | $10,052 -75% |
| 2000 | -- | $40,208 |
Find assessor info on the county website
Monthly payment
Est. payment
Payment breakdown
Explore the cost of this home by adjusting the details. Changes won't be saved.Climate risks
Neighborhood: 37814
- $157,8003 bd1 ba1k sqft1803 N Liberty Hill Rd, Morristown, TN 37814Off Market

- $106,900-- bd0 ba816 sqft1641 N Liberty Hill Rd, Morristown, TN 37814Off Market
- $285,800-- bd3 ba2.3k sqft1880 Emerson St, Morristown, TN 37814Off Market
- $95,200-- bd0 ba840 sqft1870 Emerson St, Morristown, TN 37814Off Market
Similar homes
- $--2 bd1 ba1k sqft1508 Willow St, Morristown, TN 37814Active
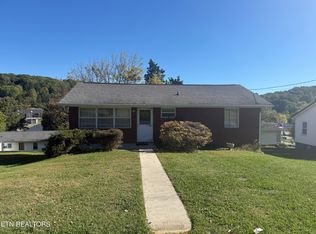
 MLS ID #1359672, Ryan George, JD's Realty & Auction, LLC. East Tennessee Realtors
- $219,9003 bd1 ba912 sqft1327 Carmichael St, Morristown, TN 37814For Sale

 MLS ID #713177, Jennifer Kelkowski, Greater Impact Realty Lakeway. Lakeway Area AOR
- $230,0003 bd2 ba910 sqft322 Gilbert St, Morristown, TN 37814For Sale
 MLS ID #712479, Nichole Raimondi, Crye-Leike Premier Real Estate LLC. Lakeway Area AOR
- $249,9002 bd1 ba930 sqft321 S Park Ave, Morristown, TN 37813For Sale
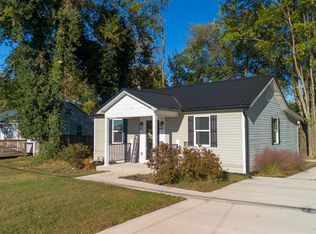 MLS ID #713366, Joey Bruce, RE/MAX Between the Lakes - Dandridge. Lakeway Area AOR
- $199,9003 bd1 ba924 sqft1779 Sherwood Dr, Morristown, TN 37814For SaleMLS ID #710965, Hix Masengill, Century 21 Masengill-McCrary. Lakeway Area AOR
- $209,9003 bd2 ba1k sqft1143 N Henry St, Morristown, TN 37814For SaleMLS ID #713440, Ronald Bledsoe, RE/MAX Real Estate Ten Midtown. Lakeway Area AOR
- $259,9003 bd1 ba1k sqft1975 Quail Hollow Rd, Morristown, TN 37814For SaleMLS ID #713201, Ben Taylor Cantwell, Greater Impact Realty Lakeway. Lakeway Area AOR
- $200,0003 bd1 ba960 sqft3839 Reeds Chapel Rd, Morristown, TN 37814For SaleMLS ID #711449, Karen Breeding, RE/MAX Real Estate Ten Midtown. Lakeway Area AOR
- $219,9003 bd1 ba870 sqft1510 Tyler Cir, Morristown, TN 37814For SaleMLS ID #710127, Hix Masengill, Century 21 Masengill-McCrary. Lakeway Area AOR
- $209,9003 bd1 ba1.1k sqft1234 Urban Dr, Morristown, TN 37813For SaleMLS ID #713344, Greta Clark, Castle & Associates Real Estate. Lakeway Area AOR
- $248,0002 bd1 ba720 sqft626 N White Pine Rd, Talbott, TN 37877ActiveMLS ID #1359469, Becky Rainey, Crye-Leike Realtors South, Inc. East Tennessee Realtors
- $164,9002 bd1 ba978 sqft2767 Conrad Dr, Morristown, TN 37814For Sale
 MLS ID #3526597, Tony Thomas. RealTracs MLS as distributed by MLS GRID
- $199,9002 bd1 ba864 sqft910 Lennie Ave, Morristown, TN 37813For SaleMLS ID #713155, Marty Lamb, Crye-Leike Lakeway Real Estate. Lakeway Area AOR
- $245,0002 bd1 ba864 sqft5120 Buell Chapel Rd, Morristown, TN 37813For SaleMLS ID #709850, Tracey Lynn Bright, RE/MAX Real Estate Ten Midtown. Lakeway Area AOR
- $330,0003 bd1 ba1k sqft292 Sagewood Dr, Morristown, TN 37813For SaleMLS ID #713502, Ashley Lynn Hunt, RE/MAX Real Estate Ten Midtown. Lakeway Area AOR
- $224,9002 bd1 ba1.1k sqft159 Old Lee Hwy, Bean Station, TN 37708ActiveMLS ID #1354744, Jarrod Brown, Single Tree Realty. East Tennessee Realtors
- $189,9003 bd1 ba908 sqft522 W Charles St, Morristown, TN 37813For SaleMLS ID #712902, Steve Carpenter, RE/MAX Real Estate Ten Midtown. Lakeway Area AOR
- $175,0002 bd1 ba960 sqft715 Lincoln Ave, Morristown, TN 37813ActiveMLS ID #1358315, Tommy Scarlett, Realty Executives Associates. East Tennessee Realtors
