This 1150 square foot single family home has 3 bedrooms and 2.0 bathrooms. This home is located at 1712 Laney Ave SW, Albuquerque, NM 87105.
Pre-foreclosure
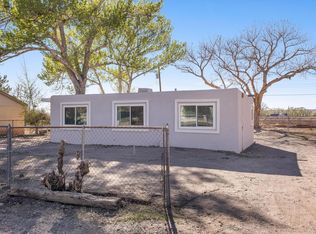
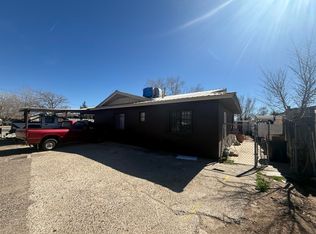
Street View
Est. $283,300
1712 Laney Ave SW, Albuquerque, NM 87105
3beds
1,150sqft
Detached
Built in 1960
0.29 Acres Lot
$283,300 Zestimate®
$246/sqft
$-- HOA
Overview
- 329 days |
- 16 |
- 0 |
Facts & features
Interior
Bedrooms & bathrooms
- Bedrooms: 3
- Bathrooms: 2
- Full bathrooms: 1
- 1/2 bathrooms: 1
- Main level bedrooms: 1
Heating
- None, Forced air
Appliances
- Included: Dishwasher, Microwave, Refrigerator, Washer
- Laundry: Utility Closet
Features
- Flooring: Tile, Carpet
- Basement: None
Interior area
- Total interior livable area: 1,150 sqft
Property
Parking
- Total spaces: 1
- Parking features: Carport
Features
- Exterior features: Stucco
Lot
- Size: 0.29 Acres
- Features: Private
Details
- Parcel number: 101205316510730616
- Zoning: 02-002
Construction
Type & style
- Home type: SingleFamily
- Property subtype: Detached
Materials
- Roof: Other
Condition
- Year built: 1960
Details
- Builder name: Unknown
Utilities & green energy
- Sewer: Public Sewer
- Water: Public
Community & HOA
Location
- Region: Albuquerque
Financial & listing details
- Price per square foot: $246/sqft
- Tax assessed value: $212,921
- Date available: 03/10/2019
- Road surface type: Private
Visit our professional directory to find a foreclosure specialist in your area that can help with your home search.
Find a foreclosure agentForeclosure details
Estimated market value
$283,300
$269,000 - $297,000
$1,950/mo
Price history
| Date | Event | Price |
|---|---|---|
| 2/21/2024 | Listing removed | -- |
Source: | ||
| 11/8/2023 | Listed for sale | $294,000+30.7%$256/sqft |
Source: | ||
| 10/24/2022 | Sold | -- |
Source: | ||
| 9/14/2022 | Pending sale | $225,000$196/sqft |
Source: | ||
| 9/11/2022 | Price change | $225,000-2.2%$196/sqft |
Source: | ||
| 9/7/2022 | Pending sale | $230,000$200/sqft |
Source: | ||
| 8/30/2022 | Price change | $230,000-2.1%$200/sqft |
Source: | ||
| 8/26/2022 | Listed for sale | $235,000$204/sqft |
Source: | ||
| 6/21/2022 | Pending sale | $235,000$204/sqft |
Source: | ||
| 6/21/2022 | Listed for sale | $235,000$204/sqft |
Source: | ||
| 6/19/2022 | Listing removed | -- |
Source: | ||
| 6/14/2022 | Listed for sale | $235,000$204/sqft |
Source: | ||
| 4/13/2022 | Pending sale | $235,000$204/sqft |
Source: | ||
| 4/7/2022 | Price change | $235,000-2.1%$204/sqft |
Source: | ||
| 3/31/2022 | Listed for sale | $240,000+71.4%$209/sqft |
Source: | ||
| 5/2/2019 | Sold | -- |
Source: | ||
| 3/10/2019 | Pending sale | $140,000$122/sqft |
Source: The M Real Estate Group #939187 Report a problem | ||
| 3/10/2019 | Listed for sale | $140,000$122/sqft |
Source: The M Real Estate Group #939187 Report a problem | ||
Public tax history
| Year | Property taxes | Tax assessment |
|---|---|---|
| 2025 | -- | $70,966 +3% |
| 2024 | -- | $68,900 +3% |
| 2023 | -- | $66,893 +71% |
| 2022 | $676 -48.5% | $39,130 +2.4% |
| 2021 | $1,313 +2% | $38,210 +3% |
| 2020 | $1,287 | $37,097 +2.8% |
| 2019 | -- | $36,095 |
| 2018 | $1,069 -11.2% | $36,095 +3% |
| 2017 | $1,204 +8.3% | $35,044 +6.1% |
| 2016 | $1,112 -96.5% | $33,034 +3% |
| 2015 | $32,072 +3030.2% | $32,072 +3% |
| 2014 | $1,025 | $31,138 +3% |
| 2013 | $1,025 | $30,231 +3% |
| 2012 | -- | $29,351 +3% |
| 2011 | -- | $28,497 +3% |
| 2010 | -- | $27,667 +3% |
| 2009 | -- | $26,861 +3% |
| 2008 | -- | $26,079 +3% |
| 2007 | -- | $25,320 +3% |
| 2006 | -- | $24,583 +3% |
| 2005 | -- | $23,867 +3% |
| 2004 | -- | $23,173 +3% |
| 2003 | -- | $22,498 |
| 2002 | -- | $22,498 +2% |
| 2001 | -- | $22,065 -3.6% |
| 2000 | -- | $22,898 |
Find assessor info on the county website
Monthly payment
Estimated monthly payment$1,822
All calculations are estimates and provided by Zillow, Inc. for informational purposes only. Actual amounts may vary.
HOA fees may include property taxes on listings classified as Co-Ops. Contact the listing agent and/or owner for fee details.
Mortgage interest rates are dependent on a number of factors, including credit score, down payment, and repayment length. Interest rate data provided by Zillow Group Marketplace, Inc. as of 1/1/1970 from various mortgage lenders with which we have lead or other similar arrangements; the Estimated Payment is an average of those rates.
See how much you could borrow to make a competitive offer.
Climate risks
Neighborhood: South Valley
Nearby schools
GreatSchools rating
- 5/10Adobe Acres Elementary SchoolGrades: PK-5Distance: 0.3 mi
- 4/10Harrison Middle SchoolGrades: 6-8Distance: 0.5 mi
- 2/10Rio Grande High SchoolGrades: 9-12Distance: 2.3 mi
Schools provided by the listing agent
- Elementary: Adobe Acres
- Middle: Harrison
- High: Rio Grande
Source: The MLS. This data may not be complete. We recommend contacting the local school district to confirm school assignments for this home.


- New Mexico
- Bernalillo County
- Albuquerque
- 87105
- South Valley
- 1712 Laney Ave SW
Nearby cities
Nearby neighborhoods
Nearby zip codes
Other Albuquerque Topics
