$241,500
2 bd|2 ba|1.1k sqft
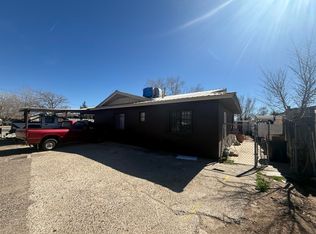
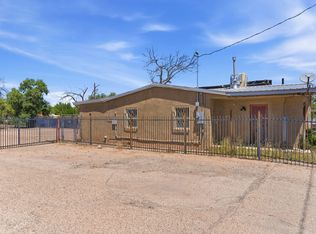
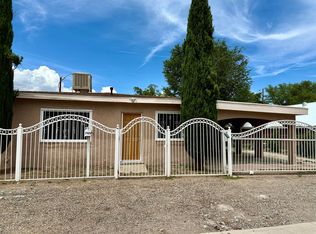
3028 Aaron Ct SW, Albuquerque, NM 87105
Off Market
Zillow last checked:
Listing updated:
Lizeth Garcia 915-401-2915,
Provenza Realty LLC 505-345-4545
$250,400
$238,000 - $263,000
$1,663/mo
| Date | Event | Price |
|---|---|---|
| 6/12/2026 | Listed for sale | $257,000+9.4%$222/sqft |
Source: | ||
| 10/1/2025 | Sold | -- |
Source: Public Record Report a problem | ||
| 9/17/2025 | Pending sale | $235,000$203/sqft |
Source: | ||
| 9/12/2025 | Price change | $235,000-2.1%$203/sqft |
Source: | ||
| 9/9/2025 | Listed for sale | $240,000+14.3%$207/sqft |
Source: | ||
| 4/16/2024 | Sold | -- |
Source: Public Record Report a problem | ||
| 4/4/2024 | Pending sale | $210,000$181/sqft |
Source: | ||
| 3/29/2024 | Price change | $210,000-2.3%$181/sqft |
Source: | ||
| 3/21/2024 | Price change | $215,000-4.4%$185/sqft |
Source: | ||
| 3/20/2024 | Price change | $225,000-5.1%$194/sqft |
Source: | ||
| 3/12/2024 | Listed for sale | $237,000+15.6%$204/sqft |
Source: | ||
| 5/7/2022 | Listing removed | $205,000$177/sqft |
Source: | ||
| 4/28/2022 | Price change | $205,000-1.9%$177/sqft |
Source: | ||
| 4/25/2022 | Price change | $209,000-2.8%$180/sqft |
Source: | ||
| 4/23/2022 | Price change | $215,000-1.8%$185/sqft |
Source: | ||
| 4/17/2022 | Price change | $219,000-4.4%$189/sqft |
Source: | ||
| 4/11/2022 | Price change | $229,000-2.6%$197/sqft |
Source: | ||
| 4/6/2022 | Price change | $235,000-3.3%$203/sqft |
Source: | ||
| 4/4/2022 | Price change | $243,000-0.8%$209/sqft |
Source: | ||
| 3/30/2022 | Listed for sale | $245,000+96%$211/sqft |
Source: | ||
| 3/16/2022 | Sold | -- |
Source: Public Record Report a problem | ||
| 12/14/2021 | Listed for sale | $125,000$108/sqft |
Source: | ||
| 11/5/2021 | Sold | -- |
Source: Public Record Report a problem | ||
| Year | Property taxes | Tax assessment |
|---|---|---|
| 2025 | $1,907 -4.6% | $51,228 -4.8% |
| 2024 | $1,998 +1.8% | $53,829 +3% |
| 2023 | $1,962 +22.8% | $52,262 +19.1% |
| 2022 | $1,598 +60.5% | $43,896 +61.6% |
| 2021 | $995 -1% | $27,164 +3% |
| 2020 | $1,005 | $26,373 +3% |
| 2019 | -- | $25,605 |
| 2018 | $809 -10.7% | $25,605 +3% |
| 2017 | $906 +7.9% | $24,860 +6.1% |
| 2016 | $840 -96.3% | $23,433 +3% |
| 2015 | $22,751 +2829.1% | $22,751 +3% |
| 2014 | $777 | $22,089 +3% |
| 2013 | $777 | $21,445 +3% |
| 2012 | -- | $20,821 +3% |
| 2011 | -- | $20,215 +3% |
| 2010 | -- | $19,627 +3% |
| 2009 | -- | $19,055 +3% |
| 2008 | -- | $18,501 +3% |
| 2007 | -- | $17,962 +3% |
| 2006 | -- | $17,440 +3% |
| 2005 | -- | $16,932 |
| 2004 | -- | $16,932 +2% |
| 2003 | -- | $16,599 |
| 2002 | -- | $16,599 |
| 2001 | -- | $16,599 -1% |
| 2000 | -- | $16,765 |
Find assessor info on the county website
Source: SWMLS. This data may not be complete. We recommend contacting the local school district to confirm school assignments for this home.
A local agent can set up tours, give advice and negotiate with sellers.