This 1160 square foot single family home has 2 bedrooms and 2.0 bathrooms. This home is located at 1713 W Fern St, Tampa, FL 33604.
Pre-foreclosure
Street View
Est. $372,100
1713 W Fern St, Tampa, FL 33604
2beds
2baths
1,160sqft
SingleFamily
Built in 1958
8,712 Square Feet Lot
$372,100 Zestimate®
$321/sqft
$-- HOA
Overview
- 356 days
- 5
- 0
Facts & features
Interior
Bedrooms & bathrooms
- Bedrooms: 2
- Bathrooms: 2
Heating
- Other
Cooling
- Central
Features
- Flooring: Concrete, Hardwood, Linoleum / Vinyl
- Has fireplace: Yes
Interior area
- Total interior livable area: 1,160 sqft
Property
Parking
- Parking features: Carport
Features
- Exterior features: Cement / Concrete
Lot
- Size: 8,712 Square Feet
Details
- Parcel number: 1828353GO000003000020A
Construction
Type & style
- Home type: SingleFamily
Materials
- masonry
- Roof: Composition
Condition
- Year built: 1958
Community & HOA
Location
- Region: Tampa
Financial & listing details
- Price per square foot: $321/sqft
- Tax assessed value: $286,132
- Annual tax amount: $5,006
Foreclosure details
Estimated market value
$372,100
$353,000 - $391,000
$1,996/mo
Price history
| Date | Event | Price |
|---|---|---|
| 11/15/2022 | Sold | $350,000+0%$302/sqft |
Source: Public Record Report a problem | ||
| 10/14/2022 | Pending sale | $349,900$302/sqft |
Source:  Stellar MLS #T3400409 Report a problem | ||
| 10/9/2022 | Price change | $349,900-5.4%$302/sqft |
Source: Stellar MLS #T3400409 Report a problem | ||
| 9/30/2022 | Price change | $369,900-2.6%$319/sqft |
Source: Stellar MLS #T3400409 Report a problem | ||
| 9/19/2022 | Price change | $379,900-2.6%$328/sqft |
Source: Stellar MLS #T3400409 Report a problem | ||
| 9/15/2022 | Price change | $389,900-2.5%$336/sqft |
Source: Stellar MLS #T3400409 Report a problem | ||
| 9/2/2022 | Price change | $399,900-2.2%$345/sqft |
Source: Stellar MLS #T3400409 Report a problem | ||
| 9/1/2022 | Listed for sale | $409,000+109.7%$353/sqft |
Source: Stellar MLS #O6056302 Report a problem | ||
| 3/17/2022 | Sold | $195,000$168/sqft |
Source: Public Record Report a problem | ||
Public tax history
| Year | Property taxes | Tax assessment |
|---|---|---|
| 2025 | $5,006 +7.4% | $286,132 +2.7% |
| 2024 | $4,662 +2.7% | $278,703 +3% |
| 2023 | $4,541 +1034.6% | $270,585 +365.9% |
| 2022 | $400 -0.7% | $58,080 +3% |
| 2021 | $403 +12.9% | $56,388 +14.3% |
| 2020 | $357 -83.3% | $49,345 -50.1% |
| 2019 | $2,135 +545.7% | $98,972 +109.1% |
| 2018 | $331 | $47,337 -39.8% |
| 2017 | $331 +3.8% | $78,608 +73.1% |
| 2016 | $318 +2.8% | $45,409 +0.7% |
| 2015 | $310 -31% | $45,093 +0.8% |
| 2014 | $449 | $44,735 +1.5% |
| 2013 | $449 +0.1% | $44,074 -0.2% |
| 2012 | $449 -23% | $44,159 -13.2% |
| 2011 | $583 -1.3% | $50,868 -2.9% |
| 2010 | $590 +1.2% | $52,403 +2.7% |
| 2009 | $583 -0.4% | $51,025 +0.1% |
| 2008 | $586 +4.4% | $50,974 +3% |
| 2007 | $561 -3.6% | $49,489 +2.5% |
| 2006 | $582 +3.1% | $48,282 +3% |
| 2005 | $564 | $46,876 +3% |
| 2004 | -- | $45,511 +1.9% |
| 2003 | -- | $44,662 +2.4% |
| 2002 | -- | $43,615 +1.6% |
| 2001 | -- | $42,928 -17.8% |
| 2000 | $395 | $52,209 |
Find assessor info on the county website
Monthly payment
Climate risks
Neighborhood: Riverbend
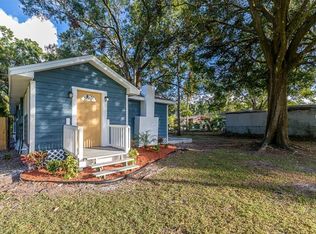

Similar homes
- $400,0003 bd2 ba1.1k sqft1112 W HIAWATHA STREET, TAMPA, FL 33604For Sale

 MLS ID #TB8559047, Hoss Pollard, LPT REALTY, LLC. Stellar MLS
- $349,0002 bd1 ba1k sqft6303 N KING STREET, TAMPA, FL 33604For Sale
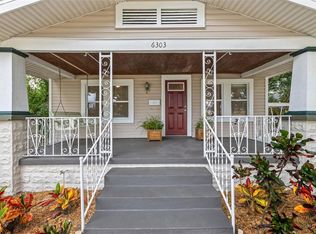 MLS ID #TB8562668, Kelly Grimsdale, PA, CHARLES RUTENBERG REALTY INC. Stellar MLS
- $369,9003 bd2 ba1k sqft6317 N CENTRAL AVENUE, TAMPA, FL 33604For Sale
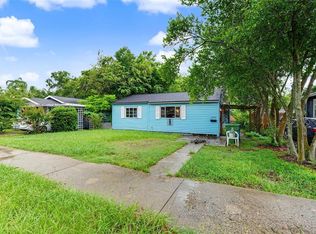 MLS ID #TB8534821, Amir Parajuli, LPT REALTY, LLC.. Stellar MLS
- $410,0003 bd2 ba1.2k sqft6703 N BOULEVARD, TAMPA, FL 33604For Sale
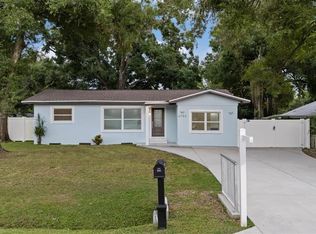 MLS ID #TB8545972, Laima Ferrer, CHARMING HOMES REALTY LLC. Stellar MLS
- $399,9003 bd2 ba1.2k sqft919 W HIAWATHA STREET, TAMPA, FL 33604For SaleMLS ID #TB8542464, MARCO OROZCO, CENTURY 21 CIRCLE. Stellar MLS
- $360,0003 bd2 ba1.2k sqft805 E LAMBRIGHT STREET, TAMPA, FL 33604For SaleMLS ID #TB8550227, Kelly Beechner, CHARLES RUTENBERG REALTY INC. Stellar MLS
- $339,0002 bd3 ba1.1k sqft6714 N HARER STREET, TAMPA, FL 33604For SaleMLS ID #TB8558921, Leslie Sibbitt, COMPASS FLORIDA LLC. Stellar MLS
- $450,0003 bd2 ba1.3k sqft309 W JEAN STREET, TAMPA, FL 33604For SaleMLS ID #TB8560410, Sage Olmo-Perez, IMPACT REALTY TAMPA BAY. Stellar MLS
- $374,9003 bd2 ba1.2k sqft2518 W NORTH STREET, TAMPA, FL 33614For SaleMLS ID #TB8506203, Roger Fruits, HOMEFRONT REALTY. Stellar MLS
- $349,0003 bd2 ba1.1k sqft7301 N OLA AVENUE, TAMPA, FL 33604For SaleMLS ID #TB8550036, Heather Shipherd, COASTAL PROPERTIES GROUP INTER. Stellar MLS
- $399,0002 bd2 ba1k sqft412 E HAMILTON AVENUE, TAMPA, FL 33604For SaleMLS ID #TB8557174, Vanessa Solis, REAL BROKER, LLC. Stellar MLS
- $440,0003 bd2 ba1.5k sqft2116 W MINNEHAHA STREET, TAMPA, FL 33604For SaleMLS ID #TB8554630, Vanessa Solis, REAL BROKER, LLC. Stellar MLS
- $405,0003 bd2 ba1.4k sqft815 W MINNEHAHA STREET, TAMPA, FL 33604For SaleMLS ID #TB8509473, Leisdianys Luis, VITA LUXURY REALTY LLC. Stellar MLS
- $400,0002 bd2 ba1k sqft4915 W BARTLETT DRIVE, TAMPA, FL 33603For SaleMLS ID #A4711057, Troy Funk, REALTY ONE GROUP MVP. Stellar MLS
- $390,0003 bd2 ba1.3k sqft703 E HAMILTON AVENUE, TAMPA, FL 33604For SaleMLS ID #TB8530687, Juan Montes, JPT REALTY LLC. Stellar MLS
- $429,9003 bd2 ba1.4k sqft6703 N RIVER BOULEVARD, TAMPA, FL 33604For SaleMLS ID #TB8562386, Noel Karell, KELLER WILLIAMS TAMPA CENTRAL. Stellar MLS
- $399,9002 bd2 ba1.1k sqft809 E FLORA STREET, TAMPA, FL 33604For SaleMLS ID #TB8554632, Amy Kincheloe, 54 REALTY LLC. Stellar MLS
- $339,9003 bd2 ba1.4k sqft7104 N 9TH STREET, TAMPA, FL 33604For SaleMLS ID #TB8557102, Luis Charbonier, Sr, CIGAR CITY REALTY LLC. Stellar MLS
- $399,0003 bd2 ba1.5k sqft8115 N OLA AVENUE, TAMPA, FL 33604For SaleMLS ID #TB8511237, Vioma Lorenzo, DALTON WADE INC. Stellar MLS
