Want a home in a great neighborhood? This first floor 1800 sq ft house, with lower level, has features beyond the inside! The large view of the woods, walk out lower level, fire pit, wild life, upper deck, lower covered patio, garage with a shop, and boat house attached to the garage and an updated inside! All features you have to see!!!
For sale by owner
$204,000
1722 20th St NW, Cedar Rapids, IA 52405
3beds
1,800sqft
SingleFamily
Built in 1967
-- sqft lot
$-- Zestimate®
$113/sqft
$-- HOA
What's special
Upper deckGarage with a shopUpdated insideFire pitLower covered patioWalk out lower level
What the owner loves about this home
This home makes living varied, fun, family events and a shop to keep the creator creating, or the working man in business! And in a great neighborhood!
- 46 days
- 610
- 36
Listed by:
Property Owner (319) 360-3780
Facts & features
Interior
Bedrooms & bathrooms
- Bedrooms: 3
- Bathrooms: 2
- Full bathrooms: 1
- 3/4 bathrooms: 1
Heating
- Forced air, Gas
Cooling
- Central
Appliances
- Included: Dishwasher, Dryer, Garbage disposal, Microwave, Range / Oven, Refrigerator, Washer
Features
- Flooring: Carpet, Concrete, Hardwood, Linoleum / Vinyl
- Basement: Finished
- Has fireplace: Yes
Interior area
- Total interior livable area: 1,800 sqft
Property
Parking
- Parking features: Carport, Garage - Detached, Off-street, On-street
Features
- Exterior features: Composition
Details
- Parcel number: 141910400300000
Construction
Type & style
- Home type: SingleFamily
Materials
- Wood
- Foundation: Concrete
- Roof: Shake / Shingle
Condition
- New construction: No
- Year built: 1967
Community & HOA
Location
- Region: Cedar Rapids
Financial & listing details
- Price per square foot: $113/sqft
- Tax assessed value: $171,500
- Annual tax amount: $2,794
- Date on market: 10/2/2026
Estimated market value
Not available
Estimated sales range
Not available
$2,176/mo
Price history
| Date | Event | Price |
|---|---|---|
| 10/2/2026 | Listed for sale | $204,000+19.6%$113/sqft |
Source: Owner Report a problem | ||
| 4/25/2023 | Sold | $170,500+11.5%$95/sqft |
Source:  CRAAR, CDRMLS #2301608 Report a problem | ||
| 3/29/2023 | Pending sale | $152,900$85/sqft |
Source: CRAAR, CDRMLS #2301608 Report a problem | ||
| 3/24/2023 | Listed for sale | $152,900$85/sqft |
Source: CRAAR, CDRMLS #2301608 Report a problem | ||
| 2/25/2023 | Listing removed | $152,900$85/sqft |
Source: CRAAR, CDRMLS #2300538 Report a problem | ||
| 2/14/2023 | Pending sale | $152,900$85/sqft |
Source: CRAAR, CDRMLS #2300538 Report a problem | ||
| 2/14/2023 | Listed for sale | $152,900$85/sqft |
Source: CRAAR, CDRMLS #2300538 Report a problem | ||
Public tax history
| Year | Property taxes | Tax assessment |
|---|---|---|
| 2025 | $2,794 +5.5% | $171,500 +4.3% |
| 2024 | $2,648 -2.6% | $164,500 +2.7% |
| 2023 | $2,718 +8.3% | $160,100 +13.5% |
| 2022 | $2,510 -3.8% | $141,100 +5.7% |
| 2021 | $2,608 +7.7% | $133,500 +2.6% |
| 2020 | $2,422 -0.6% | $130,100 +4.2% |
| 2019 | $2,438 +8.1% | $124,900 +7.4% |
| 2018 | $2,254 +3.1% | $116,300 -0.3% |
| 2017 | $2,186 -4.4% | $116,700 |
| 2016 | $2,286 +2.8% | $116,700 +1.1% |
| 2015 | $2,224 -1.9% | $115,476 |
| 2014 | $2,268 +1.7% | $115,476 |
| 2013 | $2,229 +6.3% | $115,476 -4% |
| 2012 | $2,096 | $120,275 |
| 2011 | -- | $120,275 |
| 2010 | $1,838 | $120,275 +5.1% |
| 2008 | -- | $114,483 |
| 2007 | -- | $114,483 +5.4% |
| 2005 | -- | $108,584 -1% |
| 2004 | -- | $109,728 |
| 2003 | -- | $109,728 +6.5% |
| 2002 | -- | $102,999 +14% |
| 2001 | -- | $90,350 |
| 2000 | -- | $90,350 |
Find assessor info on the county website
Monthly payment
Est. payment
Payment breakdown
Explore the cost of this home by adjusting the details. Changes won't be saved.Climate risks
Neighborhood: 52405

Similar homes
- $226,0003 bd2 ba1.4k sqft1330 Highwood Dr NW, Cedar Rapids, IA 52405For Sale
 MLS ID #202606620, Grace McCarty. Iowa City Area AOR
- $209,9003 bd2 ba1.5k sqft2200 Wes Ct NW, Cedar Rapids, IA 52405For Sale
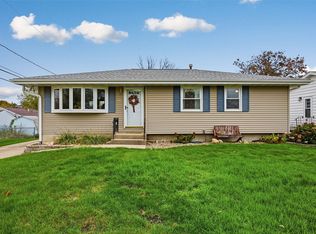 MLS ID #2607766, Jill Monnahan, SKOGMAN REALTY. CRAAR, CDRMLS
- $205,0004 bd1 ba1.9k sqft1010 Pawnee Dr NW, Cedar Rapids, IA 52405For Sale
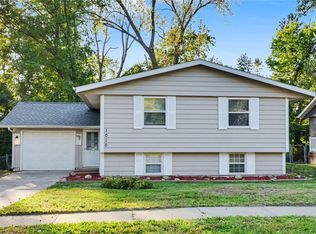 MLS ID #2607851, Mike Graf-Graf Home Selling Team, GRAF REAL ESTATE, ERA POWERED. CRAAR, CDRMLS
- $209,9004 bd2 ba1.7k sqft2623 Westwood Dr NW, Cedar Rapids, IA 52405For Sale
 MLS ID #202605645, Carla Werning. Iowa City Area AOR
