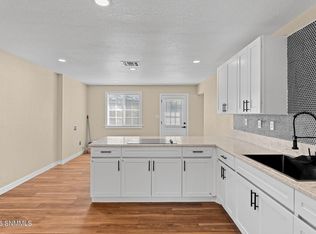
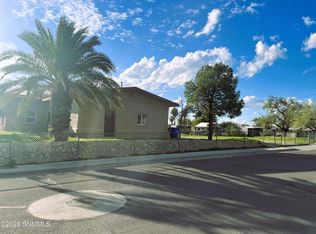
Great location. Close to shopping and schools. Cute little house that has been recently updated bathrooms, kitchen cabinets and fresh exterior paint. This home has two living areas and all appliances convey.
For sale
$209,000
1730 Boston Dr, Las Cruces, NM 88001
3beds
1,539sqft
Single Family Residence, Residential
Built in 1955
5,662 Square Feet Lot
$203,000 Zestimate®
$136/sqft
$-- HOA
What's special
Recently updated bathroomsFresh exterior paintAll appliances convey
- 38 days
- 303
- 15
Zillow last checked:
Listing updated:
Listed by:
Joanne L Achen 575-571-2761,
TND Real Estate Group 575-571-2761
Source: SNMMLS as distributed by MLS GRID,MLS#: 2603081
Facts & features
Interior
Bedrooms & bathrooms
- Bedrooms: 3
- Bathrooms: 2
- Full bathrooms: 1
- 3/4 bathrooms: 1
Primary bathroom
- Description: Shower Stall,Linoleum/Vinyl
Family room
- Features: Cth/Vaulted Ceiling, Fireplace
Kitchen
- Features: Tile Floor, Refrigerator, Electric Range
Living room
- Features: Ceiling Fan, Carpet
Heating
- Natural Gas Available, Forced Air
Cooling
- Evaporative Cooling
Appliances
- Included: Washer, Dryer
- Laundry: In Kitchen
Features
- Flooring: Flooring Foundation: Slab
- Number of fireplaces: 1
Interior area
- Total structure area: 1,539
- Total interior livable area: 1,539 sqft
Property
Features
- Levels: One
- Stories: 1
- Patio & porch: Patio
- Fencing: Block
Lot
- Size: 5,662 Square Feet
- Dimensions: 0 to .24 AC
Details
- Parcel number: 4008136519115
Construction
Type & style
- Home type: SingleFamily
- Architectural style: Ranch
- Property subtype: Single Family Residence, Residential
Materials
- Stucco
- Roof: Pitched,Shingle
Condition
- New construction: No
- Year built: 1955
Utilities & green energy
- Sewer: Public Sewer
- Water: Public
- Utilities for property: City Gas
Community & HOA
Community
- Subdivision: College Heights
HOA
- Has HOA: No
Location
- Region: Las Cruces
Financial & listing details
- Price per square foot: $136/sqft
- Tax assessed value: $102,990
- Annual tax amount: $1,040
- Date on market: 10/1/2026
Estimated market value
$203,000
$193,000 - $213,000
$1,484/mo
Price history
| Date | Event | Price |
|---|---|---|
| 10/1/2026 | Listed for sale | $209,000$136/sqft |
Source: SNMMLS as distributed by MLS GRID #2603081 Report a problem | ||
| 9/1/2026 | Listing removed | $209,000$136/sqft |
Source: SNMMLS as distributed by MLS GRID #2601886 Report a problem | ||
| 8/25/2026 | Price change | $209,000-1.4%$136/sqft |
Source: SNMMLS as distributed by MLS GRID #2601886 Report a problem | ||
| 6/24/2026 | Price change | $212,000-1.4%$138/sqft |
Source: SNMMLS as distributed by MLS GRID #2601886 Report a problem | ||
| 6/12/2026 | Listed for sale | $215,000+104.8%$140/sqft |
Source: SNMMLS as distributed by MLS GRID #2601886 Report a problem | ||
| 9/13/2024 | Listing removed | $1,200$1/sqft |
Source: Zillow Rentals Report a problem | ||
| 8/3/2024 | Listed for rent | $1,200$1/sqft |
Source: Zillow Rentals Report a problem | ||
| 7/26/2024 | Listing removed | -- |
Source: Zillow Rentals Report a problem | ||
| 7/23/2024 | Listed for rent | $1,200+60%$1/sqft |
Source: Zillow Rentals Report a problem | ||
| 7/19/2017 | Listing removed | $750 |
Source: Zillow Rental Manager Report a problem | ||
| 7/7/2017 | Listed for rent | $750 |
Source: Zillow Rental Manager Report a problem | ||
| 12/10/2010 | Sold | -- |
Source: Agent Provided Report a problem | ||
| 10/29/2010 | Listed for sale | $105,000$68/sqft |
Source: RE/MAX Infinity #814202 Report a problem | ||
Public tax history
| Year | Property taxes | Tax assessment |
|---|---|---|
| 2025 | $1,040 +2.4% | $34,330 +3% |
| 2024 | $1,015 +1.4% | $33,330 +3% |
| 2023 | $1,001 +1.6% | $32,359 +3% |
| 2022 | $985 +3.4% | $31,417 +3% |
| 2021 | $953 +2.5% | $30,502 +3% |
| 2020 | $931 -0.3% | $29,614 |
| 2019 | $933 +1.2% | $29,614 +0.6% |
| 2018 | $922 | $29,448 +3% |
| 2017 | $922 +12.2% | $28,590 +3% |
| 2016 | $822 +1.6% | $27,758 -65.7% |
| 2015 | $809 +104.9% | $80,847 +3% |
| 2014 | $395 -44.5% | $78,492 +3% |
| 2013 | $710 | $76,206 +3% |
| 2012 | $710 +4.5% | $73,986 +3% |
| 2011 | $680 +4.9% | $71,831 +3% |
| 2010 | $648 +9.6% | $69,738 +3% |
| 2009 | $591 | $67,707 +3% |
| 2008 | $591 +3.7% | $65,735 +3% |
| 2007 | $570 +4.2% | $63,821 +3% |
| 2005 | $547 +4.2% | $61,962 +6.1% |
| 2004 | $525 -10.1% | $58,400 |
| 2003 | $585 +16.2% | $58,400 -10.7% |
| 2002 | $503 | $65,400 +19.3% |
| 2001 | $503 +6.8% | $54,800 +6.2% |
| 2000 | $471 | $51,600 |
Find assessor info on the county website
Monthly payment
Est. payment
Payment breakdown
Explore the cost of this home by adjusting the details. Changes won't be saved.Climate risks
Neighborhood: 88001

Similar homes
- $220,0004 bd2 ba1.5k sqft1301 Lees Dr, Las Cruces, NM 88001For Sale
 MLS ID #2602954, Diana I Rivera, Home Pros Real Estate Group New Mexico. SNMMLS as distributed by MLS GRID
- $219,9003 bd1 ba1.7k sqft1313 Branson Ave, Las Cruces, NM 88001For Sale
 MLS ID #2601662, Marie Joyce Ludwig, Array Realty. SNMMLS as distributed by MLS GRID
- $209,0003 bd1 ba1k sqft1925 Calle De Suenos, Las Cruces, NM 88001For Sale
 MLS ID #2601755, Bill Adams, REMAX Classic Realty. SNMMLS as distributed by MLS GRID
- $199,0004 bd1 ba1.5k sqft910 S Esperanza St, Las Cruces, NM 88001For Sale
 MLS ID #2603368, Maria De La Luz Ramirez, REMAX Classic Realty. SNMMLS as distributed by MLS GRID
