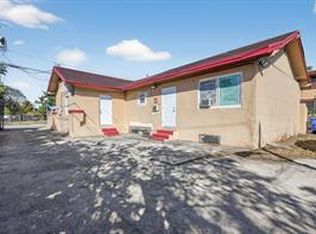
This is a great opportunity to own a Fourplex in the area of Allapattah. This Four Unit Multifamily has two 2 bedrooms/1 bath and two 1bedrooms/1 bath. Very beautiful Units. It is a great investment opportunity for Investors or for a homeowner who wants to live in 1 unit and rent the other 3 for income. Close to Little Havana, Major Highways
For sale
$1,100,000
1849 NW 35th St, Miami, FL 33142
--beds
--baths
2,450sqft
Quadruplex
Built in 1962
-- sqft lot
$-- Zestimate®
$449/sqft
$-- HOA
What's special
Very beautiful units
- 29 days
- 135
- 14
Zillow last checked:
Listing updated:
Listed by:
Adner Joseph 786-261-8602,
London Foster Realty,
Carlie Joseph 786-380-0060,
London Foster Realty
Source: MIAMI,MLS#: A12108158 Originating MLS: A-Miami Association of REALTORS
Facts & features
Interior
Heating
- Central
Cooling
- Central Air
Features
- Flooring: Tile
Interior area
- Total structure area: 2,450
- Total interior livable area: 2,450 sqft
Video & virtual tour
Property
Parking
- Total spaces: 4
Features
- Stories: 1
Lot
- Features: Less Than 1/4 Acre Lot, 1/4 To Less Than 1/2 Acre Lot
Details
- Parcel number: 0131270101250
- Zoning: 6100
Construction
Type & style
- Home type: MultiFamily
- Property subtype: Quadruplex
Materials
- Concrete Block Construction
- Roof: Other
Condition
- Year built: 1962
Utilities & green energy
- Sewer: Public Sewer
Community & HOA
Community
- Subdivision: Holleman Manor
HOA
- Has HOA: No
Location
- Region: Miami
Financial & listing details
- Price per square foot: $449/sqft
- Tax assessed value: $587,911
- Annual tax amount: $11,751
- Date on market: 10/16/2026
- Listing terms: All Cash,Conventional
Estimated market value
Not available
Estimated sales range
Not available
Not available
Price history
| Date | Event | Price |
|---|---|---|
| 10/16/2026 | Listed for sale | $1,100,000+29.4%$449/sqft |
Source:  MIAMI #A12108158 Report a problem | ||
| 6/8/2025 | Listing removed | $2,000$1/sqft |
Source: Zillow Rentals Report a problem | ||
| 1/26/2025 | Listed for rent | $2,000+60%$1/sqft |
Source: Zillow Rentals Report a problem | ||
| 4/26/2023 | Sold | $850,000-5%$347/sqft |
Source: Public Record Report a problem | ||
| 1/1/2023 | Listing removed | -- |
Source: MIAMI #A11258367 Report a problem | ||
| 10/13/2022 | Price change | $895,000-5.3%$365/sqft |
Source: MIAMI #A11258367 Report a problem | ||
| 8/22/2022 | Listed for sale | $945,000+138%$386/sqft |
Source: MIAMI #A11258367 Report a problem | ||
| 7/3/2021 | Listing removed | -- |
Source: Zillow Rental Network_1 Report a problem | ||
| 6/16/2021 | Listed for rent | $1,250$1/sqft |
Source: Zillow Rental Network_1 Report a problem | ||
| 6/6/2017 | Sold | $397,000+100.3%$162/sqft |
Source: Public Record Report a problem | ||
| 2/21/2014 | Sold | $198,200+98.2%$81/sqft |
Source: Public Record Report a problem | ||
| 10/25/2013 | Sold | $100,000-56.5%$41/sqft |
Source: Public Record Report a problem | ||
| 10/29/2004 | Sold | $230,000+35.3%$94/sqft |
Source: Public Record Report a problem | ||
| 2/13/2004 | Sold | $170,000+209.1%$69/sqft |
Source: Public Record Report a problem | ||
| 10/5/1993 | Sold | $55,000$22/sqft |
Source: Public Record Report a problem | ||
Public tax history
| Year | Property taxes | Tax assessment |
|---|---|---|
| 2025 | $11,751 +6.5% | $587,911 +6.8% |
| 2024 | $11,029 +36.5% | $550,541 +71.5% |
| 2023 | $8,078 +34.3% | $321,026 +10% |
| 2022 | $6,016 -3% | $291,842 |
| 2021 | $6,201 -0.2% | $291,842 |
| 2020 | $6,216 +2.2% | $291,842 +2.4% |
| 2019 | $6,082 +8.5% | $284,910 +6.5% |
| 2018 | $5,605 | $267,594 +21.7% |
| 2017 | $5,605 +17.5% | $219,925 +10% |
| 2016 | $4,769 +18% | $199,932 +10% |
| 2015 | $4,041 -1.3% | $181,757 +0.7% |
| 2014 | $4,094 +9.8% | $180,538 |
| 2013 | $3,728 | $180,538 -12.4% |
| 2012 | $3,728 -1.5% | $206,159 -0.7% |
| 2011 | $3,786 -19.4% | $207,652 -11.8% |
| 2010 | $4,697 -13% | $235,517 -14.7% |
| 2009 | $5,398 -3.2% | $276,089 +9.7% |
| 2007 | $5,577 +18.7% | $251,728 |
| 2006 | $4,697 | -- |
| 2005 | $4,697 +25.3% | -- |
| 2004 | $3,748 +39.7% | -- |
| 2003 | $2,682 +9.8% | -- |
| 2002 | $2,443 | -- |
| 2001 | $2,443 | -- |
Find assessor info on the county website
Monthly payment
Est. payment
Payment breakdown
Explore the cost of this home by adjusting the details. Changes won't be saved.Climate risks
Neighborhood: Allapattah


Similar homes
- $1,000,0006 bd4 ba2k sqftEby Park, Miami, FL 33142For Sale

 MLS ID #A12112536, Fabrizio Quintana, London Foster Realty. MIAMI
- $1,074,0004 bd4 ba3k sqftHolleman Manor Addn, Miami, FL 33142For Sale
 MLS ID #A11944416, Lourdes Muro, All Hud Realty and Management,. MIAMI
- $1,100,00011 bd5 ba1.7k sqft2168 NW 28TH Street, Miami, FL 33142For Sale
 MLS ID #B26095212, Lisa Feltrinelli, LoKation. BeachesMLS
- $1,150,0009 bd3 ba1.9k sqft3025 NW 8TH Avenue, Miami, FL 33127For Sale
 MLS ID #B26099977, Bruna Kunhasky, Sealine Realty Inc. BeachesMLS
- $799,9995 bd3 ba2.4k sqftWesthaven, Miami, FL 33142For SaleMLS ID #A12113066, Justin Kirkwood, Luxe Properties. MIAMI
- $1,055,0008 bd4 ba3.5k sqftOrchard Villa Extension, Miami, FL 33142For SaleMLS ID #A12052741, Johana Parra, Realty One Group Evolution. MIAMI
- $585,0003 bd3 ba1.9k sqftMelrose Heights, Miami, FL 33142For SaleMLS ID #A12121499, Oscar Arellano Jr., Coldwell Banker Realty. MIAMI
- $810,0004 bd4 ba2.1k sqftCravatts Allapattah Homes, Miami, FL 33142For SaleMLS ID #A12001094, Enolismel Padilla, LP Realty Group. MIAMI
- $875,7004 bd4 ba2.5k sqftCaples Amd Pl, Miami, FL 33142For SaleMLS ID #A11392942, Roberto Claro, Pinnacle Realty of Florida Corp. MIAMI
- $875,7004 bd4 ba2.3k sqftCaples Amd Pl, Miami, FL 33142For SaleMLS ID #A11389399, Roberto Claro, Pinnacle Realty of Florida Corp. MIAMI
- $698,0006 bd3 ba2.5k sqftMelrose Heights, Miami, FL 33142For SaleMLS ID #A12115768, Justine Jimenez Garcia, Countywide Properties ERA Powe. MIAMI
- $1,134,9005 bd4 ba2.5k sqftOcoee Park, Miami, FL 33125For SaleMLS ID #A12069712, Nicole Trenk, Luxe Properties. MIAMI
- $895,0008 bd4 ba2.2k sqftNo Miami Est Sec 3, Miami, FL 33142For SaleMLS ID #A12021879, Ezequiel Baredes, BM2 Realty. MIAMI
- $595,9006 bd3 ba1.7k sqft17th Ave Manor 2nd Addn, Miami, FL 33142For SaleMLS ID #A12119971, Idalia Nunez, London Foster Realty. MIAMI
- $1,100,0008 bd4 ba2.9k sqftKenwood Sub, Miami, FL 33125For SaleMLS ID #A12042518, Sean Guim, Onyx Realty. MIAMI
- $590,0004 bd3 ba1.4k sqftLefler & Jones Prop, Miami, FL 33142For SaleMLS ID #A12118225, Francisco Campos, Campos Commercial Real Estate LLC. MIAMI
- $900,000-- bd-- ba3.1k sqftHolleman Manor, Miami, FL 33142For SaleMLS ID #A12074554, Karla Arteche, The Agency RE, LLC. MIAMI
- $610,0005 bd3 ba1.9k sqftMelrose Heights 4th Sec, Miami, FL 33142For SaleMLS ID #A12123744, Edna Cabrera, Legacy Realty Partners, LLC.. MIAMI
- $995,0008 bd6 ba2.6k sqftWest End Park Amd Pl, Miami, FL 33142New ConstructionMLS ID #A12055496, Miguel Marino, Cespedes Realty LLC. MIAMI
- $610,0007 bd4 ba2.7k sqftHolleman Manor, Miami, FL 33142For SaleMLS ID #A12075194, Miguel Fuentes, Fausto Commercial Realty Consultants Inc. MIAMI
