3 bedroom, 1.5 bath ranch located in a quiet neighborhood with new refinished hardwood floors. The garage door and gutters are new and the exterior trim was recently painted. An assortment of shade trees provide for a quiet and private back yard. Convenient to businesses on Rt 28, southside beaches, and Bayberry golf course.
For sale
$584,900
20 Harding Lane, West Yarmouth, MA 02673
3beds
1,100sqft
Single Family Residence
Built in 1969
9,583 Square Feet Lot
$570,500 Zestimate®
$532/sqft
$-- HOA
What's special
Attached garageNew garage doorRecent double pane windowsRecent sliderPainted exterior trim
- 19 days
- 966
- 34
Likely to sell faster than
Zillow last checked:
Listing updated:
Listed by:
Daniel J Michael 508-280-5315,
Main Street Realty
Source: CCIMLS,MLS#: 22605259
Facts & features
Interior
Bedrooms & bathrooms
- Bedrooms: 3
- Bathrooms: 2
- Full bathrooms: 1
- 1/2 bathrooms: 1
Heating
- Natural Gas
Cooling
- None
Appliances
- Included: Dishwasher, Gas Range, Range Hood, Water Heater
Features
- Flooring: Hardwood
- Basement: Full
- Number of fireplaces: 1
Interior area
- Total structure area: 1,100
- Total interior livable area: 1,100 sqft
Property
Parking
- Total spaces: 1
- Parking features: Driveway, Paved
- Attached garage spaces: 1
- Has uncovered spaces: Yes
Features
- Stories: 1
Lot
- Size: 9,583 Square Feet
- Features: Level
Details
- Parcel number: YARM M:0058 B:0101 L:0000
- Special conditions: None
Construction
Type & style
- Home type: SingleFamily
- Property subtype: Single Family Residence
Materials
- Shingle Siding, Vinyl Siding
- Roof: Asphalt
Condition
- Year built: 1969
Utilities & green energy
- Water: Public
Community & HOA
Location
- Region: West Yarmouth
Financial & listing details
- Price per square foot: $532/sqft
- Tax assessed value: $494,600
- Annual tax amount: $3,447
- Date on market: 10/15/2026
- Cumulative days on market: 14 days
Estimated market value
$570,500
$542,000 - $599,000
$2,971/mo
Price history
| Date | Event | Price |
|---|---|---|
| 10/15/2026 | Listed for sale | $584,900+172%$532/sqft |
Source:  CCIMLS #22605259 Report a problem | ||
| 6/5/2015 | Sold | $215,000-4.4%$195/sqft |
Source: CCIMLS #21503679 Report a problem | ||
| 4/24/2015 | Listed for sale | $225,000$205/sqft |
Source: ERA Cape Real Estate, LLC #21503679 Report a problem | ||
Public tax history
| Year | Property taxes | Tax assessment |
|---|---|---|
| 2025 | $3,090 +4.5% | $436,400 +8.9% |
| 2024 | $2,958 +1.2% | $400,800 +11.1% |
| 2023 | $2,924 +11% | $360,600 +30.8% |
| 2022 | $2,635 | $275,600 |
| 2021 | $2,635 +2% | $275,600 +6.7% |
| 2020 | $2,583 +7.7% | $258,300 +8.8% |
| 2019 | $2,399 +5.8% | $237,500 +7.8% |
| 2018 | $2,267 +4.8% | $220,300 +2% |
| 2017 | $2,164 +4.5% | $216,000 +4.1% |
| 2016 | $2,070 -2.5% | $207,400 -1.9% |
| 2015 | $2,122 +2.6% | $211,400 +4.2% |
| 2014 | $2,068 +2.3% | $202,900 -0.8% |
| 2013 | $2,021 +2.7% | $204,600 -2.9% |
| 2012 | $1,967 +5.2% | $210,800 -2.6% |
| 2011 | $1,870 +6.7% | $216,400 -4.6% |
| 2010 | $1,752 +3.5% | $226,900 -9.7% |
| 2009 | $1,692 +2.1% | $251,400 -5.5% |
| 2008 | $1,657 +0.3% | $266,000 -5.2% |
| 2007 | $1,652 +8.5% | $280,500 +9.3% |
| 2006 | $1,522 +5.7% | $256,600 +21.9% |
| 2005 | $1,440 -38.3% | $210,500 |
| 2004 | $2,332 | $210,500 |
| 2003 | $2,332 +90.5% | $210,500 +85% |
| 2001 | $1,224 | $113,800 |
Find assessor info on the county website
Monthly payment
Est. payment
Payment breakdown
Explore the cost of this home by adjusting the details. Changes won't be saved.Climate risks
Neighborhood: West Yarmouth
Similar homes
- $609,0004 bd1 ba1.1k sqft2 Constance Avenue E, West Yarmouth, MA 02673For Sale
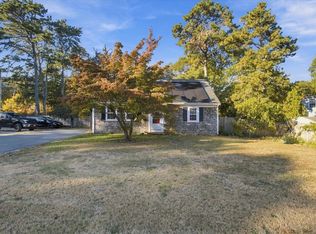
 MLS ID #22605518, Louis Guerrier, Seaport Village Realty. CCIMLS
- $629,9002 bd2 ba1.3k sqft4 Frost Avenue, West Yarmouth, MA 02673For Sale
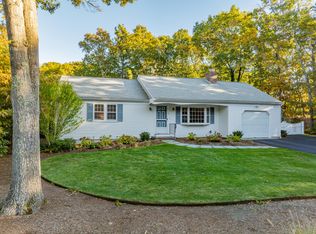 MLS ID #22605380, Steve Silva, William Raveis Real Estate & Home Services. CCIMLS
- $549,0002 bd2 ba1.2k sqft38 McNamara Avenue, West Yarmouth, MA 02673For Sale
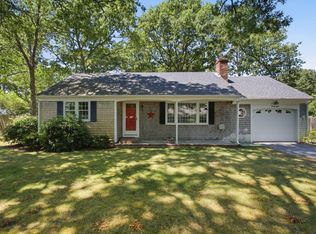 MLS ID #22603866, Christa Zevitas, Berkshire Hathaway HomeServices Robert Paul Properties. CCIMLS
- $449,9002 bd1 ba768 sqft17 Sioux Road, West Yarmouth, MA 02673For Sale
 MLS ID #22605513, Susan E Contonio, McPhee Associates Realty. CCIMLS
- $587,0003 bd1 ba1k sqft28 Lakefield Road, South Yarmouth, MA 02664For SaleMLS ID #22605347, Thiago L Monteiro, William Raveis Real Estate & Home Services. CCIMLS
- $545,0002 bd1 ba1.1k sqft28 Hoover Road, West Yarmouth, MA 02673For SaleMLS ID #22603131, Andrea A Desouza, By the C Realty and Property Management. CCIMLS
- $515,0002 bd1 ba888 sqft50 Shallow Brook Road, South Yarmouth, MA 02664For SaleMLS ID #22605359, Ned B Chatelain, Chatelain Real Estate. CCIMLS
- $579,0002 bd2 ba1.2k sqft90 Captain York Road, South Yarmouth, MA 02664For SaleMLS ID #22604720, C Gary Maradian, GMP Properties. CCIMLS
- $679,0003 bd3 ba1.1k sqft38 Captain Small Road, South Yarmouth, MA 02664For SaleMLS ID #22605280, Tori Harrison Farr, Sotheby's International Realty, Inc.. CCIMLS
- $499,0003 bd2 ba1k sqft47 Acres Avenue, West Yarmouth, MA 02673For SaleMLS ID #22603718, Michele L Billingsley, LPT Realty. CCIMLS
- $549,5003 bd2 ba1.5k sqft20 Kent Lane, Hyannis, MA 02601For SaleMLS ID #22605264, Brian G Cobb, CRS, Kinlin Grover Compass. CCIMLS
- $649,0003 bd2 ba1.3k sqft2 Mohegan Lane, Yarmouth Port, MA 02675For SaleMLS ID #22605035, The Cape House Team, William Raveis Real Estate & Home Services. CCIMLS
- $625,0002 bd2 ba1.3k sqft844 W Yarmouth Road, Yarmouth Port, MA 02675For SaleMLS ID #22604887, Ryan Mann, Sotheby's International Realty. CCIMLS
- $495,0002 bd1 ba1k sqft11 Lauries Lane, South Yarmouth, MA 02664For SaleMLS ID #22605521, Donna J Gilson, McDevitt REALTORS. CCIMLS
- $525,0002 bd1 ba944 sqft32 Powhatan Road, South Yarmouth, MA 02664For SaleMLS ID #22605351, Aaron O'Brien, Keller Williams Realty. CCIMLS
- $699,9993 bd2 ba1.3k sqft119 Governors Way, Barnstable, MA 02630For SaleMLS ID #22605491, Patrick J Foran, Foran Realty. CCIMLS
