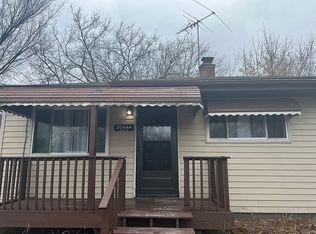
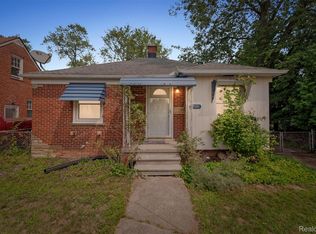
WELCOME HOME TO THIS CHARMING REDFORD RANCH! This well-maintained home features a bright and inviting living room filled with natural light, three generously sized bedrooms, and an eat-in kitchen with appliances included. Hardwood floors lie beneath the newer carpeting, offering additional potential and character.
Active
Price cut: $5K (7/13)
$140,000
20436 Inkster Rd, Redford, MI 48240
3beds
888sqft
:
Get pre-qualified$1,119/mo
Single Family Residence
Built in 1958
5,227 Square Feet Lot
$136,600 Zestimate®
$158/sqft
$-- HOA
What's special
Hardwood floorsThree generously sized bedrooms
- 54 days |
- 277 |
- 21 |
Zillow last checked:
Listing updated:
Listed by:
Keith Jourdan 734-330-5081,
Preferred, Realtors Ltd 734-459-6000
Source: MichRIC,MLS#: 26027385
Facts & features
Interior
Bedrooms & bathrooms
- Bedrooms: 3
- Bathrooms: 1
- Full bathrooms: 1
- Main level bedrooms: 3
Heating
- Forced Air
Appliances
- Laundry: Main Level
Features
- Basement: Crawl Space
- Has fireplace: No
Interior area
- Total structure area: 888
- Total interior livable area: 888 sqft
Property
Features
- Stories: 1
Lot
- Size: 5,227 Square Feet
- Dimensions: 40.00 x 128.11
Details
- Parcel number: 79004040858000
Construction
Type & style
- Home type: SingleFamily
- Architectural style: Ranch
- Property subtype: Single Family Residence
Materials
- Vinyl Siding
Condition
- New construction: No
- Year built: 1958
Utilities & green energy
- Sewer: Public Sewer
- Water: Public
Community & HOA
Location
- Region: Redford
Financial & listing details
- Price per square foot: $158/sqft
- Tax assessed value: $30,931
- Date on market: 6/5/2026
- Listing terms: Cash,FHA,VA Loan,MSHDA,Conventional
Estimated market value
$136,600
$130,000 - $143,000
$1,500/mo
Price history
| Date | Event | Price |
|---|---|---|
| 7/13/2026 | Price change | $140,000-3.4%$158/sqft |
Source: | ||
| 6/18/2026 | Price change | $145,000-3.3%$163/sqft |
Source: | ||
| 6/5/2026 | Listed for sale | $150,000+114.3%$169/sqft |
Source: | ||
| 10/1/2024 | Listing removed | $1,425$2/sqft |
Source: Zillow Rentals Report a problem | ||
| 9/27/2024 | Listed for rent | $1,425$2/sqft |
Source: Zillow Rentals Report a problem | ||
| 1/21/2020 | Sold | $70,000$79/sqft |
Source: Public Record Report a problem | ||
| 11/7/2019 | Pending sale | $70,000$79/sqft |
Source: Real Estate One #219094417 Report a problem | ||
| 10/22/2019 | Listed for sale | $70,000$79/sqft |
Source: Real Estate One #219094417 Report a problem | ||
| 10/6/2019 | Pending sale | $70,000$79/sqft |
Source: Real Estate One #219094417 Report a problem | ||
| 10/2/2019 | Price change | $70,000-6.7%$79/sqft |
Source: Real Estate One #219094417 Report a problem | ||
| 9/29/2019 | Listed for sale | $75,000+130.8%$84/sqft |
Source: Real Estate One #219094417 Report a problem | ||
| 3/14/2016 | Sold | $32,500-13.3%$37/sqft |
Source: | ||
| 2/15/2016 | Pending sale | $37,500$42/sqft |
Source: CENTURY 21 Row #215108486 Report a problem | ||
| 10/6/2015 | Listed for sale | $37,500$42/sqft |
Source: Century 21 Row #215108486 Report a problem | ||
Public tax history
Tax history is unavailable.
Find assessor info on the county website
Monthly payment
Est. payment
Payment breakdown
Explore the cost of this home by adjusting the details. Changes won't be saved.Climate risks
Neighborhood: Chesterfield
Nearby schools
GreatSchools rating
- 5/10Botsford Elementary SchoolGrades: PK-5Distance: 0.7 mi
- 4/10Clarenceville Middle SchoolGrades: 6-8Distance: 1 mi
- 5/10Clarenceville High SchoolGrades: 9-12Distance: 1.1 mi
- $117,700-- bd1 ba812 sqft20430 Inkster Rd, Redford, MI 48240Off Market
- $121,7003 bd1 ba888 sqft20444 Inkster Rd, Redford, MI 48240Off Market
- $132,3003 bd1 ba924 sqft20424 Inkster Rd, Redford, MI 48240Off Market
- $101,200-- bd1 ba847 sqft20450 Inkster Rd, Redford, MI 48240Off Market
- $143,3003 bd1 ba962 sqft20437 Seminole, Redford, MI 48240Off Market
- $146,4003 bd2 ba962 sqft20431 Seminole, Redford, MI 48240Off Market
- $136,700-- bd1 ba892 sqft20425 Seminole, Redford, MI 48240Off Market
- $191,2003 bd2 ba1.5k sqft20445 Seminole St, Redford, MI 48240Off Market
A local agent can set up tours, give advice and negotiate with sellers.
Similar homes
- $150,0003 bd2 ba952 sqft20015 Five Points St, Redford, MI 48240For Sale

 MLS ID #20261055252, Joseph Hammel, Keller Williams Somerset. Realcomp II
 - $145,0003 bd1 ba960 sqft18628 Wakenden, Redford, MI 48240For Sale

 MLS ID #26023936, Keith Jourdan, Preferred, Realtors Ltd. MichRIC
 - $179,9003 bd1 ba939 sqft20435 Norborne, Redford, MI 48240For Sale
 MLS ID #26037992, Yvonne Mroz, Propel Property Management. MichRIC
 - $129,9992 bd1 ba1.2k sqft19580 Brady, Redford, MI 48240For Sale
 MLS ID #20251023809, Kevin Kwapis, EXP Realty - Mark White & Associates. Realcomp II
 - $175,0004 bd1 ba1k sqft19364 Seminole, Redford, MI 48240For SaleMLS ID #26035088, Hiba Bilbeisi, Real Estate One Inc. MichRIC
- $--3 bd1 ba1.1k sqft14821 Strathmoor St, Detroit, MI 48227AuctionAuction.com 2
- $144,9003 bd1 ba1k sqft19786 Prevost St, Detroit, MI 48235For SaleMLS ID #20261032879, Ryan E Kain, RE/MAX Leading Edge. Realcomp II
- $149,9003 bd1 ba1k sqft7445 Rockdale, Detroit, MI 48239For SaleMLS ID #20261057617, Ali Karkaba, Keller Williams Legacy. Realcomp II
- $194,9003 bd2 ba1.1k sqft18678 Gaylord, Redford, MI 48240For SaleMLS ID #20261021404, Andrew Whisler, Community Choice Realty Associates, LLC. Realcomp II
- $120,0003 bd1 ba999 sqft13542 Dolphin St, Detroit, MI 48223For SaleMLS ID #20261057852, Kestiny Todd, EXP Realty Main. Realcomp II
- $125,0002 bd1 ba1k sqft20212 Mada Ave, Southfield, MI 48075For Sale
 MLS ID #50212819, Dylan Jennings, Realteam Real Estate. MiRealSource
 - $99,0002 bd1 ba708 sqft17241 Beech Daly Rd, Redford, MI 48240For SaleMLS ID #26021539, Daniel Wickman, Redfin Corporation. MichRIC
- $129,9003 bd1 ba1.2k sqft16876 Harlow St, Detroit, MI 48235For SaleMLS ID #50206947, Salvatore Delisi, Select RE Prof - James Ray & Associates. MiRealSource
- $149,9003 bd1 ba926 sqft1338 Helen St, Inkster, MI 48141For SaleMLS ID #20261053228, Ali Eldirani, RE/MAX Leading Edge. Realcomp II
- $179,9003 bd2 ba1.1k sqft19947 Heyden St, Detroit, MI 48219For SaleMLS ID #50214322, Francine Kanalos, Epique Inc.. MiRealSource
- $135,0004 bd2 ba1k sqft17809 Binder Street, Detroit, MI 48212For SaleMLS ID #20261057469, Hasan Khan. eXp Realty
- $109,0003 bd1 ba899 sqft20043 Fenmore St, Detroit, MI 48235For SaleMLS ID #26032162, Desiree Bourgeois, Redfin Corporation. MichRIC
- $129,7005 bd2 ba1.2k sqft26718 Penn St, Inkster, MI 48141For SaleMLS ID #20261056216, Hiba Saad, Keller Williams Legacy. Realcomp II
- $124,9993 bd1 ba1k sqft29468 Edward Dr, Inkster, MI 48141For SaleMLS ID #20261029573, Thergam Alshara, Keller Williams Legacy. Realcomp II
- $139,9003 bd1 ba900 sqft7541 Orchard Ave, Warren, MI 48091For SaleMLS ID #26034989, Julie Dunville, Redfin Corporation. MichRIC
