Home is close to gas stations, eateries, bus routes, mall. Come and make this home yours or as a great investment property. Home needs TLC.
For sale
Price cut: $20K (10/26)
$39,999
2082 Primrose St, Beaumont, TX 77703
3beds
1,500sqft
Single Family Residence
Built in ----
-- sqft lot
$-- Zestimate®
$27/sqft
$-- HOA
What's special
- 5 days
- 219
- 4
Likely to sell faster than
Zillow last checked:
Listing updated:
Listed by:
Tracie Conyers 409-499-8095,
Keller Williams Elite
Source: BBOR,MLS#: 271958
Facts & features
Interior
Bedrooms & bathrooms
- Bedrooms: 3
- Bathrooms: 2
- Full bathrooms: 2
Dining room
- Features: Breakfast Room
Living room
- Features: Both
Heating
- Central Electric
Cooling
- Central Electric
Features
- Has fireplace: No
Interior area
- Total structure area: 1,500
- Total interior livable area: 1,500 sqft
Property
Features
- Levels: One
- Stories: 1
Details
- Parcel number: 02335000000810000000
- Special conditions: Standard
Construction
Type & style
- Home type: SingleFamily
- Property subtype: Single Family Residence
Materials
- Foundation: Chain Wall, Slab
- Roof: Arch. Comp. Shingle
Community & HOA
Community
- Subdivision: Gold Hill
HOA
- Has HOA: No
Location
- Region: Beaumont
Financial & listing details
- Price per square foot: $27/sqft
- Tax assessed value: $72,721
- Annual tax amount: $731
- Date on market: 10/24/2026
- Listing terms: Cash,Conventional
Estimated market value
Not available
Estimated sales range
Not available
$1,648/mo
Price history
| Date | Event | Price |
|---|---|---|
| 10/26/2026 | Price change | $39,999-33.3%$27/sqft |
Source:  BBOR #271958 Report a problem | ||
| 10/24/2026 | Listed for sale | $59,999$40/sqft |
Source: BBOR #271958 Report a problem | ||
Public tax history
| Year | Property taxes | Tax assessment |
|---|---|---|
| 2025 | $731 +10.8% | $59,572 +10% |
| 2024 | $660 -53.1% | $54,156 -7.5% |
| 2023 | $1,407 +11.4% | $58,532 +21.1% |
| 2022 | $1,263 +17.4% | $48,336 +18.8% |
| 2021 | $1,076 +32.6% | $40,688 +28.9% |
| 2020 | $811 | $31,577 +6.1% |
| 2019 | $811 -2.5% | $29,760 |
| 2018 | $832 +1.8% | $29,760 |
| 2017 | $818 -0.1% | $29,760 |
| 2016 | $818 +0.2% | $29,760 |
| 2015 | $817 | $29,760 |
| 2014 | $817 | $29,760 +13.9% |
| 2013 | -- | $26,120 +0% |
| 2012 | -- | $26,110 |
| 2011 | -- | $26,110 -17.3% |
| 2010 | -- | $31,570 +12.3% |
| 2009 | -- | $28,100 -11% |
| 2008 | -- | $31,570 +15.5% |
| 2007 | -- | $27,340 +58.5% |
| 2006 | -- | $17,250 -22.9% |
| 2005 | -- | $22,370 +12.5% |
| 2004 | -- | $19,880 |
| 2003 | -- | $19,880 -8.2% |
| 2002 | -- | $21,650 |
| 2001 | -- | $21,650 -8.8% |
| 2000 | -- | $23,740 |
Find assessor info on the county website
Monthly payment
Est. payment
Payment breakdown
Explore the cost of this home by adjusting the details. Changes won't be saved.Climate risks
Neighborhood: North End
Similar homes
- $42,5002 bd1 ba862 sqft4665 Buffalo St, Beaumont, TX 77703For Sale
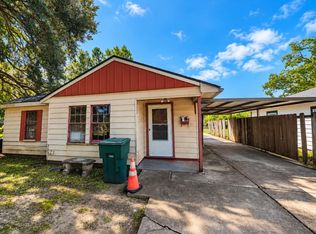
 MLS ID #272057, Michael DeLuna, Connect Realty. BBOR
- $55,5003 bd1 ba1.1k sqft2039 Earl St, Beaumont, TX 77703For Sale
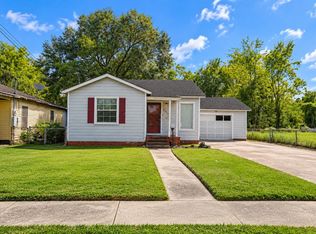 MLS ID #272056, Michael DeLuna, Connect Realty. BBOR
- $46,0003 bd1 ba1.2k sqft2104 Plum St, Beaumont, TX 77703For Sale By Owner
- $45,0003 bd1 ba1k sqft2045 Leight St, Beaumont, TX 77703For Sale
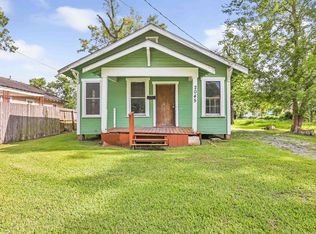 MLS ID #271012, Deanna Parsons, Hill & Associates. BBOR
- $34,5002 bd1 ba1.1k sqft3435 Cherry Dr, Beaumont, TX 77703For SaleMLS ID #267543, Randy Ragsdale, American Real Estate - Orange. BBOR
- $40,0003 bd2 ba1.2k sqft7515 Greenfield Dr, Beaumont, TX 77713For SaleMLS ID #271382, Jacob Thompson, RTX Realty -- 9016344. BBOR
- $20,0002 bd1 ba1.1k sqft1078 Amarillo St, Beaumont, TX 77701For SaleMLS ID #272050, Alba Madsen, Connect Realty. BBOR
- $34,9003 bd2 ba1.5k sqft6795 Willis Ln, Beaumont, TX 77708For SaleMLS ID #271332, Charity Angelle, RE/MAX ONE. BBOR
- $59,0004 bd2 ba1.4k sqft2460 Emile St, Beaumont, TX 77701For SaleMLS ID #270196, Andres Sanchez, American Real Estate ERA Power - Beaumont. BBOR
- $40,0003 bd2 ba1.9k sqft7780 Easley Dr, Beaumont, TX 77713For SaleMLS ID #267081, Jacob Thompson, RTX Realty -- 9016344. BBOR
- $40,0002 bd1 ba1.1k sqft755 Terry Rd, Vidor, TX 77662For SaleMLS ID #269129, Adam LeDoux, eXp Realty, LLC. BBOR
- $28,0003 bd1 ba1k sqft670 Primrose St, Vidor, TX 77662For SaleMLS ID #271176, Desha Byars, Top Tier Realty. BBOR
- $59,5003 bd1 ba1k sqft2190 Frazier St, Vidor, TX 77662For SaleMLS ID #266464, Amanda Green, JLA Realty. BBOR
