$220,646
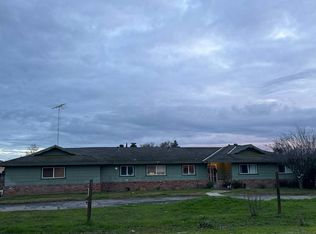
3 bd2 ba1.4k sqft
2050 Nelander Rd, Stevinson, CA 95374
Off Market
Zillow last checked:
Listing updated:
Alma Gonzalez 01823654 831-801-6321,
Genesis Real Estate 831-682-1904

Not available
Estimated sales range
Not available
Not available
| Date | Event | Price |
|---|---|---|
| 10/3/2026 | Contingent | $525,000$337/sqft |
Source:  MLSListings Inc #ML82063513 Report a problem | ||
| 10/3/2026 | Listed for sale | $525,000+1%$337/sqft |
Source: MLSListings Inc #ML82063513 Report a problem | ||
| 1/28/2026 | Sold | $520,000-13.3%$334/sqft |
Source: MetroList Services of CA #225128872 Report a problem | ||
| 11/7/2025 | Pending sale | $600,000$386/sqft |
Source: MetroList Services of CA #225128872 Report a problem | ||
| 10/3/2025 | Listed for sale | $600,000+23.7%$386/sqft |
Source: MetroList Services of CA #225128872 Report a problem | ||
| 4/3/2023 | Sold | $485,000-7.6%$312/sqft |
Source: HomeSmart Intl Solds #223013220_95374 Report a problem | ||
| 3/4/2023 | Pending sale | $525,000$337/sqft |
Source: MetroList Services of CA #223013220 Report a problem | ||
| 2/18/2023 | Listed for sale | $525,000+176.3%$337/sqft |
Source: MetroList Services of CA #223013220 Report a problem | ||
| 12/31/2015 | Sold | $190,000$122/sqft |
Source: MetroList Services of CA #15013105 Report a problem | ||
| Year | Property taxes | Tax assessment |
|---|---|---|
| 2026 | -- | $514,685 +2% |
| 2025 | $5,642 +1.7% | $504,594 +2% |
| 2024 | $5,549 +43.7% | $494,700 +41.6% |
| 2023 | $3,862 +0.9% | $349,361 +3.2% |
| 2022 | $3,826 +6.1% | $338,644 +2.8% |
| 2021 | $3,606 +1.5% | $329,340 +2.1% |
| 2020 | $3,551 -1.7% | $322,711 -0.5% |
| 2019 | $3,613 +8.6% | $324,400 +1.5% |
| 2018 | $3,326 +64.6% | $319,452 +64.8% |
| 2017 | $2,020 +2% | $193,800 +2% |
| 2016 | $1,980 +110% | $190,000 +112.7% |
| 2015 | $943 +2.4% | $89,336 +2% |
| 2014 | $921 -0.1% | $87,587 +0.5% |
| 2013 | $922 | $87,192 +2% |
| 2012 | -- | $85,484 +2% |
| 2011 | -- | $83,809 +0.8% |
| 2010 | -- | $83,184 +3.1% |
| 2009 | -- | $80,665 -0.5% |
| 2008 | -- | $81,070 +7.4% |
| 2007 | -- | $75,495 +1.7% |
| 2006 | -- | $74,224 +1.7% |
| 2005 | -- | $72,978 +3.4% |
| 2004 | -- | $70,556 -6.3% |
| 2003 | -- | $75,286 +1.6% |
| 2002 | -- | $74,109 +1.6% |
| 2001 | -- | $72,956 |
Source: MLSListings Inc. This data may not be complete. We recommend contacting the local school district to confirm school assignments for this home.
A local agent can set up tours, give advice and negotiate with sellers.


Local buyer's agents are ready to help
