Very nice well-kept property. This is a Gem in the desert with so many trees,olives,nuts,almonds,peaches.This property has a lot of potential. Newer garage door,floors,A/C Unit, Huge storage room.
Very motivated seller.
CALL ME TO PREVIEW.
For sale
Price cut: $4K (10/13)
$279,990
20900 Georgetown St, California City, CA 93505
3beds
1,420sqft
Single Family Residence
Built in 1980
10,018 Square Feet Lot
$279,000 Zestimate®
$197/sqft
$-- HOA
What's special
Newer garage doorHuge storage room
- 78 days
- 381
- 29
Zillow last checked:
Listing updated:
Listed by:
Elizabeth C Gonzalez DRE #01171456 661-992-0082,
Century 21 Masters
Source: GAVAR,MLS#: 26006019
Facts & features
Interior
Bedrooms & bathrooms
- Bedrooms: 3
- Bathrooms: 2
- Full bathrooms: 2
Heating
- Natural Gas
Cooling
- Has cooling: Yes
Appliances
- Included: Disposal, None
- Laundry: In Garage
Features
- Flooring: Tile, Laminate
- Has fireplace: Yes
- Fireplace features: Gas, Living Room
Interior area
- Total structure area: 1,420
- Total interior livable area: 1,420 sqft
Property
Parking
- Total spaces: 2
- Parking features: Garage - Attached
- Attached garage spaces: 2
Features
- Stories: 1
- Pool features: None
- Fencing: Back Yard,Front Yard,Chain Link,Wood
Lot
- Size: 10,018 Square Feet
- Features: Rectangular Lot
Details
- Parcel number: 21019114
- Zoning: R1
- Horse amenities: Boarding Facilities
Construction
Type & style
- Home type: SingleFamily
- Architectural style: Contemporary,Ranch,Spanish
- Property subtype: Single Family Residence
Materials
- Block, Concrete, Stucco, Wood Siding
- Foundation: Slab
- Roof: Shingle
Condition
- Year built: 1980
Utilities & green energy
- Sewer: Septic Tank
- Water: Public
- Utilities for property: Natural Gas Available, Cable Available, Internet
Community & HOA
Location
- Region: California City
Financial & listing details
- Price per square foot: $197/sqft
- Tax assessed value: $163,200
- Date on market: 8/3/2026
- Listing agreement: Exclusive Right To Sell
- Listing terms: USDA Loan,Cash,CAL-VET,Conventional,FHA
- Road surface type: Paved
Estimated market value
$279,000
$265,000 - $293,000
$1,896/mo
Price history
| Date | Event | Price |
|---|---|---|
| 10/13/2026 | Price change | $279,990-1.4%$197/sqft |
Source:  GAVAR #26006019 Report a problem | ||
| 10/10/2026 | Price change | $283,990-0.4%$200/sqft |
Source: GAVAR #26006019 Report a problem | ||
| 9/11/2026 | Price change | $284,990-1.7%$201/sqft |
Source: GAVAR #26006019 Report a problem | ||
| 8/3/2026 | Listed for sale | $289,990+81.2%$204/sqft |
Source: GAVAR #26006019 Report a problem | ||
| 10/30/2024 | Sold | $160,000$113/sqft |
Source: GAVAR #24006655 Report a problem | ||
| 9/4/2024 | Pending sale | $160,000$113/sqft |
Source: GAVAR #24006655 Report a problem | ||
| 9/4/2024 | Listed for sale | $160,000+28%$113/sqft |
Source: GAVAR #24006655 Report a problem | ||
| 3/13/2022 | Listing removed | -- |
Source: GAVAR #21010856 Report a problem | ||
| 11/29/2021 | Pending sale | $125,000-23.7%$88/sqft |
Source: GAVAR #21010856 Report a problem | ||
| 7/4/2020 | Listing removed | $163,900$115/sqft |
Source: Century 21 Yarrow & Associate #19011841 Report a problem | ||
| 11/5/2019 | Listed for sale | $163,900+31.1%$115/sqft |
Source: Century 21 Yarrow & Assoc. #19011841 Report a problem | ||
| 9/1/2017 | Sold | $125,000$88/sqft |
Source: GAVAR #17002935 Report a problem | ||
| 6/5/2017 | Pending sale | $125,000$88/sqft |
Source: Realty Executives Platinum #17002935 Report a problem | ||
| 4/2/2017 | Listed for sale | $125,000+53.4%$88/sqft |
Source: Realty Executives Platinum #17002935 Report a problem | ||
| 6/20/2016 | Listing removed | $81,500$57/sqft |
Source: Owner Report a problem | ||
| 5/31/2016 | Listed for sale | $81,500+8.7%$57/sqft |
Source: Owner Report a problem | ||
| 11/6/2015 | Sold | $75,000-64.3%$53/sqft |
Source: Public Record Report a problem | ||
| 3/29/2006 | Sold | $210,000$148/sqft |
Source: Public Record Report a problem | ||
Public tax history
| Year | Property taxes | Tax assessment |
|---|---|---|
| 2026 | -- | $163,200 +2% |
| 2025 | $2,119 +5.7% | $160,000 +14.7% |
| 2024 | $2,004 +8% | $139,436 +2% |
| 2023 | $1,856 +1.6% | $136,703 +2% |
| 2022 | $1,826 | $134,023 +2% |
| 2021 | -- | $131,396 +1% |
| 2020 | $1,775 +0.2% | $130,050 |
| 2019 | $1,772 +1.7% | $130,050 +4% |
| 2018 | $1,742 +43.9% | $125,000 +63.4% |
| 2017 | $1,211 +7.9% | $76,500 +2% |
| 2016 | $1,123 +5.2% | $75,000 +8.7% |
| 2015 | $1,067 +23.6% | $69,000 +30.2% |
| 2014 | $864 | $53,000 +29.9% |
| 2013 | -- | $40,800 +13.3% |
| 2012 | $709 +11.3% | $36,000 |
| 2011 | $637 +11% | $36,000 +15.4% |
| 2010 | $574 -5.8% | $31,200 -25.7% |
| 2009 | $610 -57.4% | $42,000 -62.5% |
| 2008 | $1,432 -40.1% | $112,000 -44% |
| 2007 | $2,390 +142.1% | $200,000 +159.2% |
| 2006 | $987 +1.8% | $77,157 +2% |
| 2005 | $970 -0.4% | $75,646 |
| 2004 | $974 +1.8% | $75,646 +1.9% |
| 2003 | $956 | $74,260 +4% |
| 2002 | $956 +18.4% | $71,378 +2% |
| 2001 | $808 | $69,979 |
| 2000 | -- | $69,979 |
Find assessor info on the county website
Monthly payment
Est. payment
Payment breakdown
Explore the cost of this home by adjusting the details. Changes won't be saved.Climate risks
Neighborhood: 93505
- $232,5003 bd2 ba1.2k sqft20908 Georgetown St, California City, CA 93505Off Market
- $310,0003 bd2 ba1.3k sqft20848 Georgetown St, California City, CA 93505For Sale
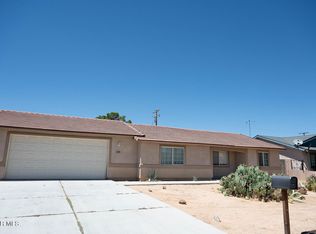
- $17,6634 bd2 ba2.1k sqft20901 California City Blvd, California City, CA 93505Off Market
- $236,6003 bd2 ba1k sqft20849 California City Blvd, California City, CA 93505Off Market

Similar homes
- $249,9903 bd2 ba1.3k sqft20925 Georgetown St, California City, CA 93505For Sale
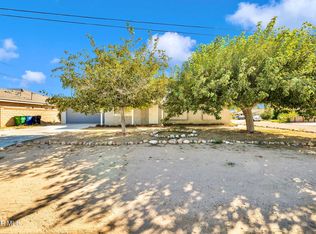 MLS ID #26007875, Sam Urban. GAVAR
- $274,9995 bd3 ba1.2k sqft21400 Jupiter Pl, California City, CA 93505For Sale
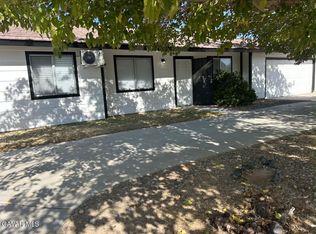 MLS ID #26007504, Derek M Haro. GAVAR
- $310,0003 bd2 ba1.3k sqft20848 Georgetown St, California City, CA 93505For SaleMLS ID #26006973, Michael Shaub. GAVAR
- $274,9003 bd2 ba1.5k sqft10611 Garibaldi Dr, California City, CA 93505For Sale
 MLS ID #26004810, Netzahualcoy Sanchez. GAVAR
