Bright & Inviting California City Home!
Welcome to this charming 3-bedroom, 2-bath single-story home offering 1,301 sq. ft. of comfortable living space on a spacious 0.25-acre lot. Perfectly blending function and style, this property features a light-filled open layout, a well-appointed kitchen, and generous bedrooms for the whole family. Enjoy the freedom of a large yard—ideal for entertaining, gardening, or simply soaking up the desert sunsets. Conveniently located near local parks, schools, and amenities, this home offers excellent value whether you're looking for your first home, downsizing, or investing.
For sale
$249,990
20925 Georgetown St, California City, CA 93505
3beds
1,301sqft
Single Family Residence
Built in 1991
0.25 Acres Lot
$250,100 Zestimate®
$192/sqft
$-- HOA
What's special
Generous bedroomsLight-filled open layoutWell-appointed kitchen
- 6 days
- 179
- 15
Likely to sell faster than
Zillow last checked:
Listing updated:
Listed by:
Sam Urban DRE #02027092 661-474-6977,
Real Brokerage Technologies
Source: GAVAR,MLS#: 26007875
Facts & features
Interior
Bedrooms & bathrooms
- Bedrooms: 3
- Bathrooms: 2
- Full bathrooms: 2
Cooling
- Has cooling: Yes
Appliances
- Included: None
Features
- Has fireplace: No
- Fireplace features: None
Interior area
- Total structure area: 1,301
- Total interior livable area: 1,301 sqft
Property
Parking
- Total spaces: 2
- Parking features: Garage
- Garage spaces: 2
Features
- Stories: 1
- Pool features: None
Lot
- Size: 0.25 Acres
Details
- Parcel number: 21019201004
- Zoning: R1
Construction
Type & style
- Home type: SingleFamily
- Architectural style: Traditional
- Property subtype: Single Family Residence
Materials
- Stucco
- Foundation: Slab
- Roof: Shingle
Condition
- Year built: 1991
Utilities & green energy
- Sewer: Alternative Septic
- Water: Public
- Utilities for property: Cable Available, Internet
Community & HOA
Location
- Region: California City
Financial & listing details
- Price per square foot: $192/sqft
- Tax assessed value: $281,430
- Date on market: 10/13/2026
- Listing agreement: Exclusive Right To Sell
- Listing terms: VA Loan,USDA Loan,1031 Exchange,Cash,Conventional,FHA
- Road surface type: Dirt
Estimated market value
$250,100
$238,000 - $263,000
$1,851/mo
Price history
| Date | Event | Price |
|---|---|---|
| 10/13/2026 | Listed for sale | $249,990+8.9%$192/sqft |
Source:  GAVAR #26007875 Report a problem | ||
| 10/22/2025 | Listing removed | $229,500$176/sqft |
Source: GAVAR #25006312 Report a problem | ||
| 8/15/2025 | Listed for sale | $229,500-13.4%$176/sqft |
Source: GAVAR #25006312 Report a problem | ||
| 5/22/2024 | Listing removed | -- |
Source: GAVAR #24002996 Report a problem | ||
| 5/21/2024 | Listing removed | -- |
Source: Zillow Rentals Report a problem | ||
| 4/24/2024 | Price change | $265,000+1.1%$204/sqft |
Source: GAVAR #24002996 Report a problem | ||
| 4/11/2024 | Listed for rent | $2,100$2/sqft |
Source: Zillow Rentals Report a problem | ||
| 3/20/2024 | Listing removed | -- |
Source:  CLAW #24-355629 Report a problem | ||
| 2/7/2024 | Listed for rent | $2,100$2/sqft |
Source: CLAW #24-355629 Report a problem | ||
| 12/14/2023 | Pending sale | $261,990$201/sqft |
Source: GAVAR #23007284 Report a problem | ||
| 12/8/2023 | Price change | $261,990-1.1%$201/sqft |
Source: GAVAR #23007284 Report a problem | ||
| 10/18/2023 | Listed for sale | $264,995-1.8%$204/sqft |
Source:  CLAW #23-323057 Report a problem | ||
| 10/10/2023 | Listing removed | -- |
Source: GAVAR #23005508 Report a problem | ||
| 9/7/2023 | Price change | $269,900-3.6%$207/sqft |
Source: GAVAR #23005508 Report a problem | ||
| 8/17/2023 | Price change | $279,9000%$215/sqft |
Source: GAVAR #23005508 Report a problem | ||
| 8/9/2023 | Listed for sale | $280,000+7.7%$215/sqft |
Source: GAVAR #23005508 Report a problem | ||
| 6/10/2022 | Sold | $260,000+4%$200/sqft |
Source: Public Record Report a problem | ||
| 5/5/2022 | Pending sale | $249,999$192/sqft |
Source:  CRMLS #HD22063432 Report a problem | ||
| 4/4/2022 | Listed for sale | $249,999$192/sqft |
Source: CRMLS #HD22063432 Report a problem | ||
Public tax history
| Year | Property taxes | Tax assessment |
|---|---|---|
| 2026 | -- | $281,430 +2% |
| 2025 | $3,520 -5.4% | $275,913 +2% |
| 2024 | $3,720 +12.6% | $270,504 +2% |
| 2023 | $3,303 +90.9% | $265,200 +111.2% |
| 2022 | $1,730 | $125,570 +2% |
| 2021 | -- | $123,109 +1% |
| 2020 | $1,678 +1.1% | $121,848 +3.3% |
| 2019 | $1,659 +8.5% | $118,000 +10.3% |
| 2018 | $1,530 +0.4% | $107,000 +5.9% |
| 2017 | $1,524 +34.4% | $101,000 +32.9% |
| 2016 | $1,134 +6.3% | $76,000 +10.1% |
| 2015 | $1,067 +28.9% | $69,000 +38% |
| 2014 | $828 | $50,000 +13.1% |
| 2013 | -- | $44,200 +13.3% |
| 2012 | $749 +10.9% | $39,000 |
| 2011 | $676 -16.3% | $39,000 -21.1% |
| 2010 | $807 -44.8% | $49,400 -52.3% |
| 2009 | $1,461 +5.1% | $103,490 +2% |
| 2008 | $1,389 +5.7% | $101,462 +2% |
| 2007 | $1,314 +0.5% | $99,474 +2% |
| 2006 | $1,307 +1.7% | $97,525 +2% |
| 2005 | $1,285 -0.6% | $95,614 |
| 2004 | $1,294 +71.5% | $95,614 +56.7% |
| 2003 | $755 | $61,000 +26.8% |
| 2002 | $755 +16.4% | $48,100 |
| 2001 | $648 | $48,100 |
| 2000 | -- | $48,100 |
Find assessor info on the county website
Monthly payment
Est. payment
Payment breakdown
Explore the cost of this home by adjusting the details. Changes won't be saved.Climate risks
Neighborhood: 93505
- $380,1004 bd2 ba2.3k sqft20933 Georgetown St, California City, CA 93505Off Market
- $275,0003 bd2 ba1.7k sqft20991 Georgetown St, California City, CA 93505Sold

- $322,5004 bd3 ba2k sqft10600 Aspen Ave, California City, CA 93505Sold
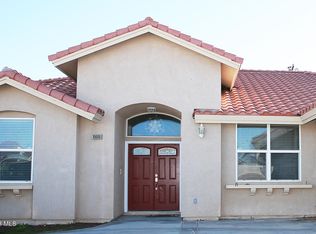
- $286,5003 bd2 ba1.6k sqft10608 Aspen Ave, California City, CA 93505Off Market

Similar homes
- $279,9903 bd2 ba1.4k sqft20900 Georgetown St, California City, CA 93505For Sale
 MLS ID #26006019, Elizabeth C Gonzalez. GAVAR
- $274,9995 bd3 ba1.2k sqft21400 Jupiter Pl, California City, CA 93505For Sale
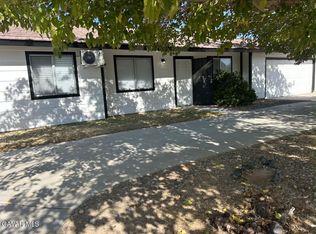 MLS ID #26007504, Derek M Haro. GAVAR
- $251,9903 bd2 ba1.2k sqft7130 California City Blvd, California City, CA 93505For Sale
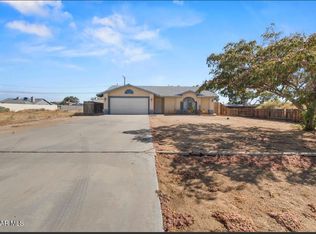 MLS ID #26006437, Lelainy A Saavedra. GAVAR
- $299,0003 bd2 ba1.5k sqft9020 Redwood Blvd, California City, CA 93505For Sale
 MLS ID #26007992, Jasmin Cruz. GAVAR
