Newly remodeled 3+2 house with a huge bonus room in the back.
For sale
Price cut: $10.1K (11/11)
$254,900
8720 S Loop Blvd, California City, CA 93505
3beds
1,887sqft
Single Family Residence
Built in 1991
9,583 Square Feet Lot
$252,500 Zestimate®
$135/sqft
$-- HOA
What's special
Newly remodeledHuge bonus room
- 45 days
- 242
- 26
Zillow last checked:
Listing updated:
Listed by:
George Mamayan DRE #01330709 818-974-7650,
Mamayan Realty Inc
Source: GAVAR,MLS#: 26007623
Facts & features
Interior
Bedrooms & bathrooms
- Bedrooms: 3
- Bathrooms: 2
- Full bathrooms: 2
Cooling
- Has cooling: Yes
Appliances
- Included: Dishwasher, Disposal, Gas Range, Microwave, Refrigerator, None
Features
- Has fireplace: No
- Fireplace features: None
Interior area
- Total structure area: 1,887
- Total interior livable area: 1,887 sqft
Property
Parking
- Total spaces: 2
- Parking features: Garage - Attached
- Attached garage spaces: 2
Features
- Stories: 1
- Patio & porch: Covered
- Pool features: None
- Fencing: Block,Vinyl,Wood
Lot
- Size: 9,583 Square Feet
- Features: Rectangular Lot
Details
- Parcel number: 20319303
- Zoning: R1
Construction
Type & style
- Home type: SingleFamily
- Architectural style: Modern
- Property subtype: Single Family Residence
Materials
- Stucco, Wood Siding
- Foundation: Slab
- Roof: Shingle
Condition
- Year built: 1991
Utilities & green energy
- Sewer: Septic Tank
- Water: Public
- Utilities for property: Natural Gas Available
Community & HOA
Location
- Region: California City
Financial & listing details
- Price per square foot: $135/sqft
- Tax assessed value: $240,000
- Date on market: 10/2/2026
- Listing agreement: Exclusive Right To Sell
- Listing terms: VA Loan,USDA Loan,Cash,FHA
- Road surface type: Paved
Estimated market value
$252,500
$240,000 - $265,000
$2,213/mo
Price history
| Date | Event | Price |
|---|---|---|
| 11/11/2026 | Price change | $254,900-3.8%$135/sqft |
Source:  GAVAR #26007623 Report a problem | ||
| 10/2/2026 | Listed for sale | $265,000+65.6%$140/sqft |
Source: GAVAR #26007623 Report a problem | ||
| 4/27/2020 | Sold | $160,000-3%$85/sqft |
Source: GAVAR #19012588 Report a problem | ||
| 2/27/2020 | Pending sale | $165,000$87/sqft |
Source: Coldwell Banker Best Realty California City #19012588 Report a problem | ||
| 2/14/2020 | Listed for sale | $165,000$87/sqft |
Source: Coldwell Banker Best Realty California City #19012588 Report a problem | ||
| 2/12/2020 | Pending sale | $165,000$87/sqft |
Source: Coldwell Banker Best Realty California City #19012588 Report a problem | ||
| 1/15/2020 | Listed for sale | $165,000-2.9%$87/sqft |
Source: Coldwell Banker Best Realty California City #19012588 Report a problem | ||
| 6/29/2019 | Price change | $170,000-2.9%$90/sqft |
Source: Coldwell Banker Best Realty #9977884 Report a problem | ||
| 1/28/2019 | Price change | $175,000-2.7%$93/sqft |
Source: Coldwell Banker Best Realty #9977884 Report a problem | ||
| 10/27/2018 | Price change | $179,900-5.3%$95/sqft |
Source: Coldwell Banker Best Realty #9977884 Report a problem | ||
| 8/29/2018 | Listed for sale | $189,900+9.8%$101/sqft |
Source: Coldwell Banker Best Realty #18009196 Report a problem | ||
| 9/11/2017 | Sold | $173,000+1.8%$92/sqft |
Source: GAVAR #17005306 Report a problem | ||
| 7/10/2017 | Pending sale | $169,900$90/sqft |
Source: Coldwell Banker Best RealtyC.C #17005306 Report a problem | ||
| 6/23/2017 | Listed for sale | $169,900+71.6%$90/sqft |
Source: Coldwell Banker Best RealtyC.C #17005306 Report a problem | ||
| 5/27/2015 | Sold | $99,000+230%$52/sqft |
Source: Public Record Report a problem | ||
| 10/9/2009 | Sold | $30,000-20.8%$16/sqft |
Source: Public Record Report a problem | ||
| 9/12/2009 | Listed for sale | $37,900-0.7%$20/sqft |
Source: foreclosure.com Report a problem | ||
| 8/5/2009 | Sold | $38,179$20/sqft |
Source: Public Record Report a problem | ||
Public tax history
| Year | Property taxes | Tax assessment |
|---|---|---|
| 2026 | -- | $240,000 +37.2% |
| 2025 | $2,300 -5.1% | $174,980 +2% |
| 2024 | $2,425 +9.7% | $171,550 +2% |
| 2023 | $2,210 +1.6% | $168,187 +2% |
| 2022 | $2,176 | $164,890 +2% |
| 2021 | -- | $161,657 -10.2% |
| 2020 | $2,366 +0.5% | $179,989 |
| 2019 | $2,354 +2% | $179,989 +4% |
| 2018 | $2,309 +58.8% | $173,000 +68.8% |
| 2017 | $1,454 +8.3% | $102,518 +2% |
| 2016 | $1,342 +115.6% | $100,509 +212% |
| 2015 | $623 +2.3% | $32,217 +2% |
| 2014 | $609 | $31,587 +0.5% |
| 2013 | -- | $31,445 +2% |
| 2012 | $641 +13.7% | $30,829 +2% |
| 2011 | $564 +0.9% | $30,225 +0.8% |
| 2010 | $559 -67.2% | $30,000 -75.7% |
| 2009 | $1,706 -17.3% | $123,222 -21.8% |
| 2008 | $2,062 +6% | $157,505 +2% |
| 2007 | $1,946 +60.5% | $154,418 +60.2% |
| 2006 | $1,212 +1.8% | $96,391 +2% |
| 2005 | $1,190 -7% | $94,502 |
| 2004 | $1,281 +50.2% | $94,502 +62.9% |
| 2003 | $853 | $58,000 +3.6% |
| 2002 | $853 +16.4% | $56,000 |
| 2001 | $733 | $56,000 |
| 2000 | -- | $56,000 |
Find assessor info on the county website
Monthly payment
Est. payment
Payment breakdown
Explore the cost of this home by adjusting the details. Changes won't be saved.Climate risks
Neighborhood: 93505


Similar homes
- $299,0003 bd2 ba1.5k sqft8913 Eucalyptus Ave, California City, CA 93505For Sale
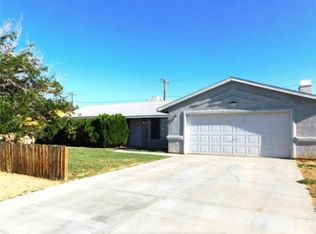 MLS ID #SR26245181, Guadalupe Ybarra, Elevate Real Estate Agency. CRMLS
- $--3 bd2 ba1.6k sqft20624 92nd St, California City, CA 93505Auction
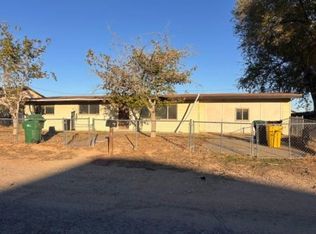 ServiceLink Auction
- $250,0003 bd2 ba1k sqft20649 Medio St, California City, CA 93505For Sale
 MLS ID #26005044, Jorge Villagran. GAVAR
- $270,0003 bd2 ba1.7k sqft20325 Airway Blvd, California City, CA 93505For Sale
 MLS ID #26006884, Virginia Meza. GAVAR
