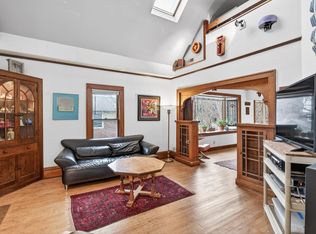
Fantastic opportunity to own an up-and-down duplex featuring classic charm, beautiful woodwork, and spacious living areas. Each unit offers 2 bedrooms, 1 bathroom, generously sized bedrooms and living spaces, and the convenience of in-unit laundry. Additional features include on-site parking, an unfinished basement, and attic space offering potential for additional storage. With a strong rental history, the main-level unit is leased until 11/30/2027, while the upper-level unit is leased through 10/31/2027. Centrally located near shopping, dining, and everyday conveniences, this property is a great opportunity for investors looking to add to their portfolio.
Active
$365,000
2104 6th St N, Minneapolis, MN 55411
4beds
2baths
2,503sqft
Duplex Up and Down
Built in 1912
-- sqft lot
$362,600 Zestimate®
$146/sqft
$-- HOA
What's special
Classic charmOn-site parkingBeautiful woodworkConvenience of in-unit laundry
- 24 days
- 341
- 32
Zillow last checked:
Listing updated:
Listed by:
Gary McCoy 651-500-6028,
Pemberton RE
Source: NorthstarMLS as distributed by MLS GRID,MLS#: 7158863
Facts & features
Interior
Bedrooms & bathrooms
- Bedrooms: 4
- Bathrooms: 2
Heating
- Baseboard
Appliances
- Laundry: In Unit
Features
- Basement: Unfinished
Interior area
- Total structure area: 4,995
- Total interior livable area: 2,503 sqft
- Finished area above ground: 2,503
- Finished area below ground: 0
Property
Parking
- Parking features: Paved Lot
Accessibility
- Accessibility features: None
Features
- Levels: Two
- Patio & porch: Deck
Lot
- Size: 0.28 Acres
- Dimensions: 78 x 157
Details
- Foundation area: 1114
- Parcel number: 1502924230195
- Zoning description: Residential-Multi-Family
Construction
Type & style
- Home type: MultiFamily
- Property subtype: Duplex Up and Down
Materials
- Roof: Asphalt
Condition
- New construction: No
- Year built: 1912
Utilities & green energy
- Gas: Natural Gas
- Sewer: City Sewer/Connected
- Water: City Water/Connected
Community & HOA
Community
- Subdivision: Renos Add
Location
- Region: Minneapolis
Financial & listing details
- Price per square foot: $146/sqft
- Tax assessed value: $367,900
- Annual tax amount: $7,355
- Date on market: 10/23/2026
- Tenant pays: Electricity, Fuel
Estimated market value
$362,600
$344,000 - $381,000
$1,944/mo
Price history
| Date | Event | Price |
|---|---|---|
| 10/23/2026 | Listed for sale | $365,000+8.3%$146/sqft |
Source:  NorthstarMLS as distributed by MLS GRID #7158863 Report a problem | ||
| 10/12/2024 | Listing removed | $1,675$1/sqft |
Source: Zillow Rentals Report a problem | ||
| 10/11/2024 | Listed for rent | $1,675+24.1%$1/sqft |
Source: Zillow Rentals Report a problem | ||
| 6/9/2021 | Sold | $337,000+3.7%$135/sqft |
Source: Public Record Report a problem | ||
| 3/18/2021 | Sold | $325,000$130/sqft |
Source: Public Record Report a problem | ||
| 1/8/2021 | Sold | $325,000-7.1%$130/sqft |
Source:  NorthstarMLS as distributed by MLS GRID #5691220 Report a problem | ||
| 11/9/2020 | Price change | $349,900-5.4%$140/sqft |
Source: Silverstone Realty #5646415 Report a problem | ||
| 10/12/2020 | Price change | $369,900-5.1%$148/sqft |
Source: Silverstone Realty #5646415 Report a problem | ||
| 9/19/2020 | Listed for sale | $389,900+457%$156/sqft |
Source: Silverstone Realty #5646415 Report a problem | ||
| 5/1/2019 | Listing removed | $1,350$1/sqft |
Source: Owner Report a problem | ||
| 4/1/2019 | Listed for rent | $1,350$1/sqft |
Source: Owner Report a problem | ||
| 12/21/2011 | Sold | $70,000+57.3%$28/sqft |
Source: Public Record Report a problem | ||
| 12/17/2010 | Sold | $44,503$18/sqft |
Source: Public Record Report a problem | ||
Public tax history
| Year | Property taxes | Tax assessment |
|---|---|---|
| 2026 | $7,355 +8.7% | $367,900 -5% |
| 2025 | $6,767 +21.9% | $387,300 +4.4% |
| 2024 | $5,551 +6.1% | $371,000 +6.9% |
| 2023 | $5,233 +51.7% | $347,000 +6.8% |
| 2022 | $3,449 +17.9% | $325,000 +60.1% |
| 2021 | $2,925 -3.7% | $203,000 +13.4% |
| 2020 | $3,037 +3.8% | $179,000 +12.9% |
| 2019 | $2,925 -3.7% | $158,500 +12% |
| 2018 | $3,037 +24.8% | $141,500 +18.9% |
| 2017 | $2,434 -2.3% | $119,000 -4.8% |
| 2016 | $2,490 -7.2% | $125,000 +11.4% |
| 2015 | $2,685 +17.9% | $112,200 +1.5% |
| 2014 | $2,277 +2.2% | $110,500 +12.2% |
| 2013 | $2,229 -57.8% | $98,500 -11.7% |
| 2012 | $5,286 -13.4% | $111,500 -5.1% |
| 2011 | $6,104 +135.6% | $117,500 -15.2% |
| 2010 | $2,591 -83.9% | $138,500 -29.9% |
| 2009 | $16,119 +679.9% | $197,500 +74.3% |
| 2006 | $2,067 +47.8% | $113,300 +23% |
| 2005 | $1,398 +14.7% | $92,100 +24.8% |
| 2004 | $1,219 -10.7% | $73,800 +17.3% |
| 2002 | $1,366 -33.2% | $62,900 |
| 2001 | $2,045 | -- |
Find assessor info on the county website
Monthly payment
Est. payment
Payment breakdown
Explore the cost of this home by adjusting the details. Changes won't be saved.Climate risks
Neighborhood: Hawthorne


Similar homes
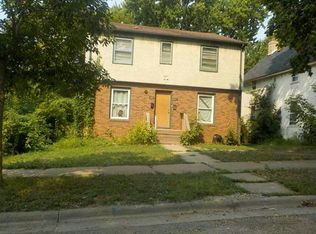
- $330,0004 bd2 ba2.3k sqft2115-2117 N Aldrich Ave N, Minneapolis, MN 55411For Sale
 MLS ID #7164292, Renee Lego, RE/MAX Results. NorthstarMLS as distributed by MLS GRID
- $--4 bd2 ba1.8k sqft2409 Bryant Ave N, Minneapolis, MN 55411Auction
 Auction.com 1
- $--5 bd2 ba1.9k sqft1014 26th Ave N, Minneapolis, MN 55411Auction
 Auction.com 1
- $369,9006 bd2 ba2.2k sqft804 Oliver Ave N, Minneapolis, MN 55411For Sale
 MLS ID #7123726, Jia Pan, Bridge Realty, LLC. NorthstarMLS as distributed by MLS GRID
- $299,5006 bd4 ba2.6k sqft2200 N 6th St, Minneapolis, MN 55411For SaleMLS ID #7143436, Miroslava C Leon, Banneker Realty, LLC. NorthstarMLS as distributed by MLS GRID
- $339,0004 bd2 ba1.7k sqft3118 Newton Ave N, Minneapolis, MN 55411For SaleMLS ID #7161680, Mark D. Heinzman, Coldwell Banker Realty. NorthstarMLS as distributed by MLS GRID
- $355,0007 bd2 ba2.7k sqft918 Queen Ave N, Minneapolis, MN 55411For SaleMLS ID #7069685, Ana Capetillo Macias, eXp Realty. NorthstarMLS as distributed by MLS GRID
- $265,0004 bd2 ba2.2k sqft820 18th Ave N, Minneapolis, MN 55411For SaleMLS ID #7121077, Kareen Anughom, Real Broker, LLC. NorthstarMLS as distributed by MLS GRID
- $325,0007 bd2 ba2.7k sqft1622 Girard Ave N, Minneapolis, MN 55411For SaleMLS ID #7124625, Scott Swennes, RE/MAX Results. NorthstarMLS as distributed by MLS GRID
- $370,0004 bd3 ba2k sqft2601 Morgan Ave N, Minneapolis, MN 55411For SaleMLS ID #7139357, Victor Martinez, Bridge Realty, LLC. NorthstarMLS as distributed by MLS GRID
- $324,9005 bd3 ba2.8k sqft1629 Bryant Ave N, Minneapolis, MN 55411For SaleMLS ID #7151754, Shamiah Sakan Thorpe, Call It Closed International Realty. NorthstarMLS as distributed by MLS GRID
- $349,9004 bd3 ba2.8k sqft1519 Sheridan Ave N, Minneapolis, MN 55411For SaleMLS ID #7156863, Julie Olson, Real-Estate-MN. NorthstarMLS as distributed by MLS GRID
- $400,0007 bd2 ba3.1k sqft1237 Knox Ave N, Minneapolis, MN 55411For SaleMLS ID #7114876, Ashley Dubose, Keller Williams Classic Rlty NW. NorthstarMLS as distributed by MLS GRID
- $329,9004 bd3 ba2.1k sqft1218 Morgan Ave N, Minneapolis, MN 55411For SaleMLS ID #7166551, Jamie Bolinger, Keller Williams Realty Integrity Lakes. NorthstarMLS as distributed by MLS GRID
- $199,0004 bd2 ba2k sqft2308 Aldrich Ave N, Minneapolis, MN 55411For SaleMLS ID #7163958, Adam Kado, Real Broker, LLC. NorthstarMLS as distributed by MLS GRID
- $299,0004 bd2 ba1.6k sqft2105 Russell Ave N, Minneapolis, MN 55411For SaleMLS ID #7170849, Derwayne Isaac Moore, Keller Williams Realty Integrity Lakes. NorthstarMLS as distributed by MLS GRID
- $329,9003 bd3 ba2.2k sqft2729 N 3rd St, Minneapolis, MN 55411For SaleMLS ID #7149147, Andy Aguilar Rios, Bridge Realty, LLC. NorthstarMLS as distributed by MLS GRID
- $290,0006 bd2 ba2.1k sqft2321 Lyndale Ave N, Minneapolis, MN 55411For SaleMLS ID #7163254, Mustaf Sahal, Fahan Realty. NorthstarMLS as distributed by MLS GRID
