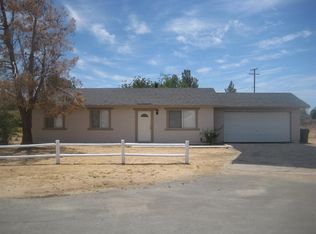
Nice Home with 3 bdr, 2 Baths, Living Room with Fireplace, Dining Area off Kitchen, Slider to covered Patio and rear fenced yard, Fenced front yard with Beautiful Big Shade Tree. Convenient location - close to schools and shopping. Had a house fire in 2015 so everything is updated, energy efficient l,and up to code as of 2016.
Pre-foreclosure
Street View
Est. $403,300
21124 Del Oro Rd, Apple Valley, CA 92308
3beds
1,257sqft
SingleFamily
Built in 1987
0.41 Acres Lot
$403,300 Zestimate®
$321/sqft
$-- HOA
Overview
- 312 days |
- 4 |
- 0 |
Facts & features
Interior
Bedrooms & bathrooms
- Bedrooms: 3
- Bathrooms: 2
- Full bathrooms: 2
Heating
- Forced air, Other, Gas, Wood / Pellet
Cooling
- Central
Appliances
- Included: Dishwasher, Garbage disposal, Microwave, Range / Oven
Features
- Flooring: Tile, Carpet
- Basement: None
- Has fireplace: Yes
Interior area
- Total interior livable area: 1,257 sqft
Property
Parking
- Total spaces: 2
- Parking features: Garage - Attached
Features
- Exterior features: Stucco
- Has view: Yes
- View description: Territorial
Lot
- Size: 0.41 Acres
Details
- Parcel number: 0434331090000
Construction
Type & style
- Home type: SingleFamily
Materials
- wood frame
- Roof: Shake / Shingle
Condition
- Year built: 1987
Community & HOA
Location
- Region: Apple Valley
Financial & listing details
- Price per square foot: $321/sqft
- Tax assessed value: $376,728
- Annual tax amount: $5,216
Visit our professional directory to find a foreclosure specialist in your area that can help with your home search.
Find a foreclosure agentForeclosure details
Estimated market value
$403,300
$383,000 - $423,000
$2,190/mo
Price history
| Date | Event | Price |
|---|---|---|
| 2/28/2022 | Sold | $355,000+1.5%$282/sqft |
Source: Public Record Report a problem | ||
| 2/2/2022 | Pending sale | $349,900$278/sqft |
Source: | ||
| 1/26/2022 | Listed for sale | $349,900$278/sqft |
Source: | ||
| 1/20/2022 | Pending sale | $349,900$278/sqft |
Source: | ||
| 1/20/2022 | Listed for sale | $349,900$278/sqft |
Source: | ||
| 1/18/2022 | Pending sale | $349,900$278/sqft |
Source: | ||
| 1/13/2022 | Listed for sale | $349,900$278/sqft |
Source: | ||
| 12/24/2021 | Pending sale | $349,900$278/sqft |
Source: | ||
| 11/4/2021 | Listed for sale | $349,900+366.5%$278/sqft |
Source: | ||
| 3/30/2012 | Sold | $75,000$60/sqft |
Source: Public Record Report a problem | ||
| 12/9/2011 | Listed for sale | $75,000+8.7%$60/sqft |
Source: Agio Real Estate Inc. AV #410677 Report a problem | ||
| 9/18/2011 | Listing removed | $69,000$55/sqft |
Source: Agio Real Estate Inc. AV #407170 Report a problem | ||
| 8/28/2011 | Listed for sale | $69,000+11.3%$55/sqft |
Source: Agio Real Estate Inc. AV #407170 Report a problem | ||
| 8/21/1998 | Sold | $62,000-35.3%$49/sqft |
Source: Public Record Report a problem | ||
| 12/18/1996 | Sold | $95,901$76/sqft |
Source: Public Record Report a problem | ||
Public tax history
| Year | Property taxes | Tax assessment |
|---|---|---|
| 2025 | $5,216 -2.5% | $376,728 +2% |
| 2024 | $5,347 -6.3% | $369,342 +2% |
| 2023 | $5,709 +396.6% | $362,100 +307.9% |
| 2022 | $1,150 +2.3% | $88,772 +2% |
| 2021 | $1,124 +1.3% | $87,032 +1% |
| 2020 | $1,110 +1.9% | $86,140 +2% |
| 2019 | $1,089 +2.5% | $84,451 +2% |
| 2018 | $1,063 +1.4% | $82,795 +2% |
| 2017 | $1,048 | $81,171 +2% |
| 2016 | $1,048 +7.8% | $79,579 +1.5% |
| 2015 | $972 +1.5% | $78,383 +2% |
| 2014 | $957 | $76,847 +0.5% |
| 2013 | -- | $76,500 -0.7% |
| 2012 | -- | $77,072 +2% |
| 2011 | -- | $75,561 +0.8% |
| 2010 | -- | $74,996 -0.2% |
| 2009 | -- | $75,174 +2% |
| 2008 | -- | $73,700 +2% |
| 2007 | -- | $72,255 +2% |
| 2006 | -- | $70,839 +2% |
| 2005 | -- | $69,450 +2% |
| 2004 | -- | $68,088 +1.9% |
| 2003 | -- | $66,840 +2% |
| 2002 | -- | $65,529 +2% |
| 2001 | -- | $64,245 +2% |
| 2000 | -- | $62,985 |
Find assessor info on the county website
Monthly payment
Estimated monthly payment$1,822
All calculations are estimates and provided by Zillow, Inc. for informational purposes only. Actual amounts may vary.
HOA fees may include property taxes on listings classified as Co-Ops. Contact the listing agent and/or owner for fee details.
Mortgage interest rates are dependent on a number of factors, including credit score, down payment, and repayment length. Interest rate data provided by Zillow Group Marketplace, Inc. as of 1/1/1970 from various mortgage lenders with which we have lead or other similar arrangements; the Estimated Payment is an average of those rates.
See how much you could borrow to make a competitive offer.
Climate risks
Neighborhood: 92308
Nearby schools
GreatSchools rating
- 3/10Sandia Elementary SchoolGrades: K-8Distance: 0.5 mi
- 5/10Apple Valley High SchoolGrades: 9-12Distance: 1 mi


- California
- San Bernardino County
- Apple Valley
- 92308
- 21124 Del Oro Rd
Nearby cities
Nearby zip codes
Other Apple Valley Topics
