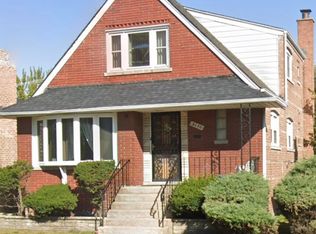
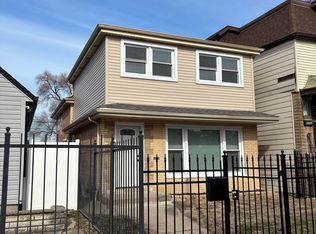
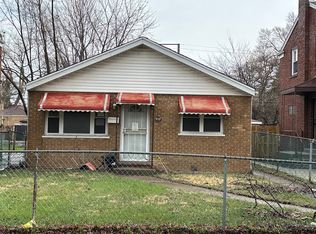
This 889 square foot single family home has 2 bedrooms and 1.0 bathrooms. This home is located at 2146 E 93rd St, Chicago, IL 60617.
Foreclosed
Est. $165,400
2146 E 93rd St, Chicago, IL 60617
2beds
1baths
889sqft
SingleFamily
Built in 1958
4,375 Square Feet Lot
$165,400 Zestimate®
$186/sqft
$-- HOA
Overview
- 399 days |
- 4 |
- 0 |
Facts & features
Interior
Bedrooms & bathrooms
- Bedrooms: 2
- Bathrooms: 1
Heating
- Forced air
Cooling
- Central
Interior area
- Total interior livable area: 889 sqft
Property
Features
- Exterior features: Stone
Lot
- Size: 4,375 Square Feet
Details
- Parcel number: 2501411048
Construction
Type & style
- Home type: SingleFamily
Materials
- Roof: Shake / Shingle
Condition
- Year built: 1958
Community & HOA
Location
- Region: Chicago
Financial & listing details
- Price per square foot: $186/sqft
- Tax assessed value: $110,000
Visit our professional directory to find a foreclosure specialist in your area that can help with your home search.
Find a foreclosure agentForeclosure details
Estimated market value
$165,400
$141,000 - $187,000
$1,732/mo
Price history
| Date | Event | Price |
|---|---|---|
| 1/3/2022 | Listing removed | -- |
Source: | ||
| 9/14/2021 | Contingent | $45,000$51/sqft |
Source: | ||
| 9/8/2021 | Listed for sale | $45,000$51/sqft |
Source: | ||
Public tax history
| Year | Property taxes | Tax assessment |
|---|---|---|
| 2024 | -- | $11,000 +0% |
| 2023 | $2,326 +2.5% | $10,999 |
| 2022 | $2,269 +124.8% | $10,999 |
| 2021 | $1,009 -28.4% | $10,999 -7.5% |
| 2020 | $1,409 +1.4% | $11,894 -9% |
| 2019 | $1,390 | $13,071 |
| 2018 | -- | $13,071 +21.6% |
| 2017 | $2,318 +78.6% | $10,745 |
| 2016 | $1,298 +13.1% | $10,745 |
| 2015 | $1,148 +9.3% | $10,745 +6.9% |
| 2014 | $1,050 -47.2% | $10,048 -7.8% |
| 2013 | $1,987 +425.4% | $10,899 |
| 2012 | $378 -12.4% | $10,899 -14.1% |
| 2011 | $432 +10.6% | $12,682 |
| 2010 | $390 +6.6% | $12,682 |
| 2009 | $366 -9.6% | $12,682 -6.1% |
| 2008 | $405 -52.4% | $13,504 |
| 2007 | $851 +2.2% | $13,504 |
| 2006 | $833 +40.4% | $13,504 +60.4% |
| 2005 | $593 -31.1% | $8,417 |
| 2004 | $861 +22.5% | $8,417 |
| 2003 | $703 -49.6% | $8,417 +8.6% |
| 2002 | $1,394 +40.4% | $7,750 |
| 2001 | $993 +4.9% | $7,750 |
| 2000 | $947 +0.7% | $7,750 +12% |
| 1999 | $941 | $6,921 |
Find assessor info on the county website
Monthly payment
Estimated monthly payment$1,822
All calculations are estimates and provided by Zillow, Inc. for informational purposes only. Actual amounts may vary.
HOA fees may include property taxes on listings classified as Co-Ops. Contact the listing agent and/or owner for fee details.
Mortgage interest rates are dependent on a number of factors, including credit score, down payment, and repayment length. Interest rate data provided by Zillow Group Marketplace, Inc. as of 1/1/1970 from various mortgage lenders with which we have lead or other similar arrangements; the Estimated Payment is an average of those rates.
See how much you could borrow to make a competitive offer.
Climate risks
Neighborhood: Pill Hill
Nearby schools
GreatSchools rating
- 5/10Warren Elementary SchoolGrades: PK-8Distance: 0.2 mi
- 1/10Bowen High SchoolGrades: 9-12Distance: 0.9 mi


- Illinois
- Cook County
- Chicago
- 60617
- Pill Hill
- 2146 E 93rd St
Nearby cities
Nearby neighborhoods
Nearby zip codes
Other Chicago Topics
