SINGLE FAMILY HOME AS PART OF A LARGER PORTFOLIO
Pending
$75,000
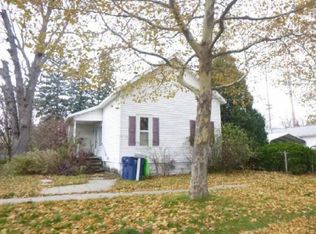
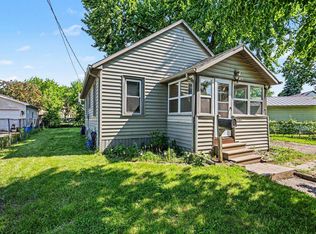
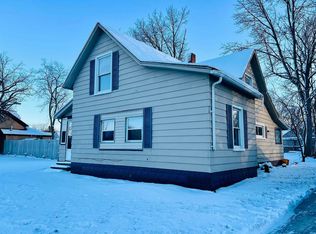
217 N Birney St, Bay City, MI 48708
2beds
828sqft
Single Family Residence
Built in 1892
0.34 Acres Lot
$75,700 Zestimate®
$91/sqft
$-- HOA
What's special
- 109 days |
- 12 |
- 0 |
Zillow last checked:
Listing updated:
Listed by:
Maria Garcia 989-443-3305,
Mid-Mitten Realty 989-401-0027
Source: MiRealSource,MLS#: 50201641 Originating MLS: Saginaw Board of REALTORS
Facts & features
Interior
Bedrooms & bathrooms
- Bedrooms: 2
- Bathrooms: 1
- Full bathrooms: 1
Bedroom 1
- Level: First
- Area: 100
- Dimensions: 10 x 10
Bedroom 2
- Level: First
- Area: 80
- Dimensions: 8 x 10
Bathroom 1
- Level: First
Kitchen
- Area: 96
- Dimensions: 12 x 8
Heating
- Forced Air, Natural Gas
Features
- Basement: Crawl Space
- Has fireplace: No
Interior area
- Total structure area: 1,656
- Total interior livable area: 828 sqft
- Finished area above ground: 828
- Finished area below ground: 0
Property
Features
- Levels: One
- Stories: 1
- Frontage type: Road
- Frontage length: 92
Lot
- Size: 0.34 Acres
- Dimensions: 92 x 160
Details
- Parcel number: 160027113021
Construction
Type & style
- Home type: SingleFamily
- Architectural style: Bungalow
- Property subtype: Single Family Residence
Materials
- Aluminum Siding
Condition
- Year built: 1892
Utilities & green energy
- Sewer: Public At Street
- Water: Public
Community & HOA
Community
- Subdivision: C081
HOA
- Has HOA: No
Location
- Region: Bay City
Financial & listing details
- Price per square foot: $91/sqft
- Tax assessed value: $63,800
- Annual tax amount: $1,339
- Date on market: 3/15/2026
- Cumulative days on market: 65 days
- Listing agreement: Exclusive Right To Sell
- Listing terms: Cash,Conventional
- Ownership type: LLC
Estimated market value
$75,700
$72,000 - $79,000
$1,160/mo
Price history
| Date | Event | Price |
|---|---|---|
| 3/15/2026 | Pending sale | $75,000$91/sqft |
Source: | ||
| 3/15/2026 | Listed for sale | $75,000$91/sqft |
Source: | ||
| 3/15/2026 | Pending sale | $75,000$91/sqft |
Source: | ||
| 3/15/2026 | Listed for sale | $75,000+138.1%$91/sqft |
Source: | ||
| 3/24/2021 | Listing removed | -- |
Source: Owner Report a problem | ||
| 8/3/2019 | Listing removed | $775$1/sqft |
Source: Owner Report a problem | ||
| 7/15/2019 | Price change | $775-3.1%$1/sqft |
Source: Owner Report a problem | ||
| 7/2/2019 | Listed for rent | $800$1/sqft |
Source: Owner Report a problem | ||
| 3/14/2019 | Sold | $31,500-9.7%$38/sqft |
Source: | ||
| 3/2/2019 | Pending sale | $34,900$42/sqft |
Source: Best Real Estate-Janca & Associates #31370104 Report a problem | ||
| 2/4/2019 | Listed for sale | $34,900+93.9%$42/sqft |
Source: Best Real Estate-Janca & Associates #31370104 Report a problem | ||
| 7/5/2017 | Listing removed | $18,000$22/sqft |
Source: RE/MAX New Image #31320082 Report a problem | ||
| 5/17/2017 | Listed for sale | $18,000+12.5%$22/sqft |
Source: RE/MAX New Image #31320082 Report a problem | ||
| 11/30/2012 | Sold | $16,000-14.9%$19/sqft |
Source: | ||
| 10/24/2012 | Listed for sale | $18,800+180.6%$23/sqft |
Source: Best Real Estate, Janca & Assoc., Inc. Report a problem | ||
| 3/20/2009 | Sold | $6,700-64.7%$8/sqft |
Source: | ||
| 11/20/2008 | Listing removed | $19,000$23/sqft |
Source: foreclosure.com Report a problem | ||
| 11/5/2008 | Listed for sale | $19,000-60.6%$23/sqft |
Source: foreclosure.com Report a problem | ||
| 1/17/2008 | Sold | $48,253$58/sqft |
Source: Public Record Report a problem | ||
Public tax history
| Year | Property taxes | Tax assessment |
|---|---|---|
| 2025 | $1,449 +14.3% | $31,900 +13.9% |
| 2024 | $1,268 | $28,000 +19.7% |
| 2023 | -- | $23,400 +12.8% |
| 2022 | -- | $20,750 +4.3% |
| 2021 | -- | $19,900 +11.2% |
| 2020 | $1,137 | $17,900 +2.9% |
| 2019 | -- | $17,400 +3% |
| 2018 | $1,137 -6.1% | $16,900 -6.1% |
| 2017 | $1,211 | $18,000 +5.3% |
| 2016 | $1,211 | $17,100 +4.6% |
| 2015 | $1,211 +1% | $16,350 -8.9% |
| 2014 | $1,198 | $17,950 +1.1% |
| 2013 | -- | $17,750 -6.1% |
| 2012 | -- | $18,900 -4.3% |
| 2011 | -- | $19,750 +6.8% |
| 2010 | -- | $18,500 -14.9% |
| 2009 | -- | $21,750 -2.5% |
| 2008 | -- | $22,300 +10.4% |
| 2007 | -- | $20,200 -3.1% |
| 2006 | -- | $20,850 |
| 2005 | -- | $20,850 +1.7% |
| 2004 | -- | $20,500 +3.5% |
| 2003 | -- | $19,800 +8.2% |
| 2002 | $1,113 | $18,300 +10.2% |
| 2000 | -- | $16,600 |
Find assessor info on the county website
Monthly payment
Est. payment$--/mo
Payment breakdown
Explore the cost of this home by adjusting the details. Changes won't be saved.All calculations are estimates and provided by Zillow, Inc. for informational purposes only. Actual amounts may vary.
HOA fees may include property taxes on listings classified as Co-Ops. Contact the listing agent and/or owner for fee details.
Mortgage interest rates are dependent on a number of factors, including credit score, down payment, and repayment length. Interest rate data provided by Zillow Group Marketplace, Inc. as of 1/1/1970 from various mortgage lenders with which we have lead or other similar arrangements; the Estimated Payment is an average of those rates.
See how much you could borrow to make a competitive offer.
Climate risks
Neighborhood: 48708
Nearby schools
GreatSchools rating
- 6/10Washington Elementary SchoolGrades: PK-5Distance: 0.4 mi
- 4/10Handy Middle SchoolGrades: 6-8Distance: 2 mi
- 6/10Bay City Central High SchoolGrades: 9-12Distance: 0.2 mi
Schools provided by the listing agent
- District: Bay City School District
Source: MiRealSource. This data may not be complete. We recommend contacting the local school district to confirm school assignments for this home.


A local agent can set up tours, give advice and negotiate with sellers.
A local lender can help you make sure your offer is ready when you are.


- Michigan
- Bay County
- Bay City
- 48708
- 217 N Birney St
Nearby cities
Nearby zip codes
Other Bay City Topics
