Great Value in Piqua. Property offers 4 bedrooms and 2 baths and is listed at 2024 above ground 1662 sqft. Home offers large living room and kitchen. Unfinished basement with mechanicals. Updated kitchen and bath. 1 car detached garage. Conveniently location close to I-75 and shopping. Home is sold as-is and room sizes have been estimated.
Foreclosure
$142,950
219 Gordon St, Piqua, OH 45356
4beds
1,664sqft
Single Family Residence
Built in 1920
3,484 Square Feet Lot
$-- Zestimate®
$86/sqft
$-- HOA
What's special
Updated kitchen
- 27 days
- 731
- 56
Zillow last checked:
Listing updated:
Listed by:
Christopher Newsome (937)667-6677,
RE/MAX One
Source: DABR MLS,MLS#: 969530 Originating MLS: Dayton Area Board of REALTORS
Facts & features
Interior
Bedrooms & bathrooms
- Bedrooms: 4
- Bathrooms: 2
- Full bathrooms: 2
Bedroom
- Level: Second
- Dimensions: 15 x 12
Bedroom
- Level: Second
- Dimensions: 16 x 14
Bedroom
- Level: Second
- Dimensions: 14 x 14
Bedroom
- Level: Second
- Dimensions: 13 x 13
Family room
- Level: Main
- Dimensions: 12 x 14
Kitchen
- Level: Main
- Dimensions: 18 x 12
Living room
- Level: Main
- Dimensions: 15 x 15
Heating
- Forced Air
Cooling
- Central Air
Features
- Basement: Partial
Interior area
- Total structure area: 1,664
- Total interior livable area: 1,664 sqft
Property
Parking
- Total spaces: 1
- Parking features: Garage, One Car Garage
- Garage spaces: 1
Features
- Levels: Two
- Stories: 2
Lot
- Size: 3,484 Square Feet
- Dimensions: .08
Details
- Parcel number: N44014010
- Zoning: Residential
- Zoning description: Residential
- Special conditions: Real Estate Owned
Construction
Type & style
- Home type: SingleFamily
- Property subtype: Single Family Residence
Materials
- Frame
Condition
- Year built: 1920
Community & HOA
Community
- Subdivision: Piqua
HOA
- Has HOA: No
Location
- Region: Piqua
Financial & listing details
- Price per square foot: $86/sqft
- Tax assessed value: $173,300
- Annual tax amount: $2,141
- Date on market: 9/23/2026
Foreclosure details
Estimated market value
Not available
Estimated sales range
Not available
$1,581/mo
Price history
| Date | Event | Price |
|---|---|---|
| 8/6/2026 | Sold | $106,667-36.9%$64/sqft |
Source:  MLS Now #5197071 Report a problem | ||
| 12/4/2024 | Listing removed | $169,000$102/sqft |
Source:  WRIST #1033820 Report a problem | ||
| 10/25/2024 | Price change | $169,000-2.9%$102/sqft |
Source: WRIST #1033820 Report a problem | ||
| 9/20/2024 | Price change | $174,000-2.8%$105/sqft |
Source: WRIST #1033820 Report a problem | ||
| 9/4/2024 | Price change | $179,000-5.3%$108/sqft |
Source: WRIST #1033820 Report a problem | ||
| 8/20/2024 | Listed for sale | $189,000+30.3%$114/sqft |
Source:  DABR MLS #918007 Report a problem | ||
| 1/31/2023 | Sold | $145,000+0.1%$87/sqft |
Source: WRIST #1020048 Report a problem | ||
| 12/19/2022 | Pending sale | $144,900$87/sqft |
Source: DABR MLS #869163 Report a problem | ||
| 12/15/2022 | Price change | $144,900-3.3%$87/sqft |
Source: WRIST #1020048 Report a problem | ||
| 11/30/2022 | Pending sale | $149,900$90/sqft |
Source: DABR MLS #869163 Report a problem | ||
| 10/29/2022 | Price change | $149,900-2.7%$90/sqft |
Source: WRIST #1020048 Report a problem | ||
| 10/10/2022 | Price change | $154,000-3.1%$93/sqft |
Source: WRIST #1020048 Report a problem | ||
| 9/16/2022 | Price change | $159,000-2.4%$96/sqft |
Source: WRIST #1020048 Report a problem | ||
| 9/8/2022 | Price change | $162,900-4.1%$98/sqft |
Source: WRIST #1020048 Report a problem | ||
| 8/16/2022 | Price change | $169,900-2.9%$102/sqft |
Source: WRIST #1020048 Report a problem | ||
| 8/8/2022 | Price change | $174,900-5.4%$105/sqft |
Source: DABR MLS #869163 Report a problem | ||
| 7/25/2022 | Listed for sale | $184,900+168.4%$111/sqft |
Source: WRIST #1020048 Report a problem | ||
| 2/3/2018 | Listing removed | $68,900$41/sqft |
Source: Cyndie Scott and Associates #401669 Report a problem | ||
| 1/9/2017 | Price change | $68,900-1.4%$41/sqft |
Source: Cyndie Scott and Associates #401669 Report a problem | ||
| 8/6/2016 | Listed for sale | $69,900-4.1%$42/sqft |
Source: Cyndie Scott and Associates #401669 Report a problem | ||
| 6/16/2015 | Price change | $72,900-1.5%$44/sqft |
Source: Cyndie Scott and Associates #364127 Report a problem | ||
| 1/23/2015 | Listed for sale | $74,000+68.2%$44/sqft |
Source: Cyndie Scott and Associates #364127 Report a problem | ||
| 5/26/2005 | Sold | $44,000$26/sqft |
Source: Public Record Report a problem | ||
Public tax history
| Year | Property taxes | Tax assessment |
|---|---|---|
| 2025 | $2,141 +61.1% | $60,660 +87.6% |
| 2024 | $1,329 -0.7% | $32,340 |
| 2023 | $1,339 -3.5% | $32,340 |
| 2022 | $1,387 +23.7% | $32,340 +34.9% |
| 2021 | $1,121 +1.7% | $23,980 |
| 2020 | $1,102 -0.5% | $23,980 |
| 2019 | $1,108 -11.3% | $23,980 -6.9% |
| 2018 | $1,249 -1.2% | $25,760 |
| 2017 | $1,264 +1% | $25,760 |
| 2016 | $1,251 +1.6% | $25,760 +4% |
| 2015 | $1,232 | $24,780 |
| 2014 | $1,232 -0.3% | $24,780 |
| 2013 | $1,236 -3.5% | $24,780 -7.9% |
| 2012 | $1,281 -0.2% | $26,920 |
| 2011 | $1,283 +15.2% | $26,920 |
| 2010 | $1,114 -6.5% | $26,920 -8.4% |
| 2009 | $1,192 +0.9% | $29,400 |
| 2008 | $1,181 -36.8% | $29,400 |
| 2007 | $1,869 +4.6% | -- |
| 2006 | $1,786 -0.4% | -- |
| 2005 | $1,794 +0.3% | -- |
| 2004 | $1,788 +3.7% | -- |
| 2003 | $1,724 +9.2% | -- |
| 2002 | $1,580 +1% | -- |
| 2001 | $1,564 +22.1% | -- |
| 2000 | $1,280 | -- |
Find assessor info on the county website
Monthly payment
Climate risks
Neighborhood: 45356
Nearby schools
Schools provided by the listing agent
- District: Piqua
Source: DABR MLS. This data may not be complete. We recommend contacting the local school district to confirm school assignments for this home.

Similar homes
- $139,9004 bd2 ba1.7k sqft507 Walker St, Piqua, OH 45356For Sale
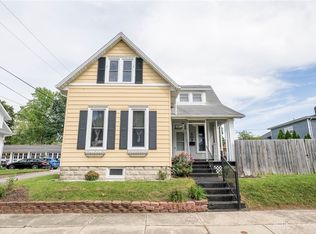
 MLS ID #968807, Timothy C Stammen, Keller Williams Home Town Rlty. DABR MLS
- $152,9002 bd1 ba1.1k sqft516 Virginia St, Piqua, OH 45356For Sale
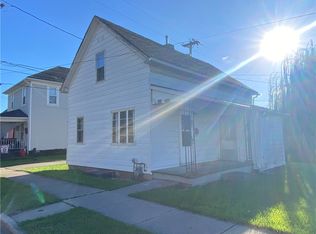 MLS ID #971393, Paolina T Quafisi, RE/MAX Alliance Realty. DABR MLS
- $152,9003 bd1 ba1.4k sqft601 Young St, Piqua, OH 45356For Sale
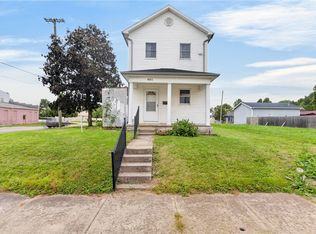 MLS ID #970343, Shari Stover, Glasshouse Realty Group. DABR MLS
- $--3 bd1 ba1.3k sqft1208 S Roosevelt Ave, Piqua, OH 45356Auction
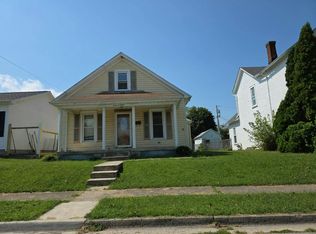 Auction.com 2
- $136,9003 bd2 ba943 sqft211 Franklin St, Piqua, OH 45356For SaleMLS ID #968088, Sue Wray, Coldwell Banker Heritage. DABR MLS
- $139,9004 bd2 ba1.8k sqft128 S Wayne St, Piqua, OH 45356For SaleMLS ID #953928, Todd Broomhall, Keller Williams Home Town Rlty. DABR MLS
- $167,0003 bd2 ba1.2k sqft359 Ridge St, Piqua, OH 45356For SaleMLS ID #968160, Shari Stover, Glasshouse Realty Group. DABR MLS
- $139,9902 bd1 ba1k sqft734 S Downing St, Piqua, OH 45356For SaleMLS ID #970240, Idan Shkedy, eXp Realty. DABR MLS
- $150,0003 bd2 ba1.3k sqft516 Boal Ave, Piqua, OH 45356For SaleMLS ID #966466, Eric M Brown, EB Real Estate. DABR MLS
- $124,9953 bd1 ba1.1k sqft501 Miami St, Piqua, OH 45356For SaleMLS ID #968727, Matthew Moehl, eXp Realty. DABR MLS
- $169,9003 bd2 ba1.2k sqft1033 W North St, Piqua, OH 45356For SaleMLS ID #967816, Paolina T Quafisi, RE/MAX Alliance Realty. DABR MLS
- $137,0003 bd1 ba1.4k sqft500 South St, Piqua, OH 45356For Sale
 MLS ID #311301, Paula Hill, EXP-Sidney Homes by Hill. WCAR OH
- $149,9002 bd1 ba1.4k sqft528 W Ash St, Piqua, OH 45356For SaleMLS ID #968096, Paolina T Quafisi, RE/MAX Alliance Realty. DABR MLS
- $165,0002 bd1 ba1.2k sqft427 S Downing St, Piqua, OH 45356For Sale
 MLS ID #1049000, Cara Stockton, Howard Hanna Real Estate Services. WRIST
- $169,9003 bd1 ba1k sqft730 Gordon St, Piqua, OH 45356For SaleMLS ID #969023, Paolina T Quafisi, RE/MAX Alliance Realty. DABR MLS
- $170,0003 bd1 ba1.6k sqft420 S Roosevelt Ave, Piqua, OH 45356For SaleMLS ID #966575, Brooke Scott, Keller Williams Home Town Rlty. DABR MLS
- $127,0002 bd1 ba1.2k sqft411 Riverside Dr, Piqua, OH 45356For SaleMLS ID #964138, Ryan Havenar, Bruns Realty Group, LLC. DABR MLS
- $99,0003 bd2 ba1.1k sqft725 Young St, Piqua, OH 45356For SaleMLS ID #969140, Matthew Kalogeras, Trelora Realty, Inc.. DABR MLS
- $123,5005 bd2 ba2.2k sqft336 South St, Piqua, OH 45356For SaleMLS ID #965748, Amy Watt, Howard Hanna Real Estate Serv. DABR MLS
- $182,9003 bd1 ba1.5k sqft609 W Ash St, Piqua, OH 45356For SaleMLS ID #967202, Paolina T Quafisi, RE/MAX Alliance Realty. DABR MLS
