this home has 3 bed, 2 baths, 1340sqft.
Fenced. Built in 2007.
Less than a mile to Cal City Blvd, yet lots of elbow room only house on street for quite a ways on the street
Lovely stained, polished cement floors, carpet in bedrooms.
Big master with giant walk in closet.
Access to Cal City OHV Trail system
Landscaping front and back- small lawns with auto sprinklers and 2 fruitless mulberry trees in the back and 2 palo verde museum in front. New central refrigerated air in 2017 and swamp cooler. Ceiling fans in living room and master bedroom.
Pre-foreclosure
Est. $240,500
21900 Neuralia Rd, California City, CA 93505
3beds
1,340sqft
SingleFamily
Built in 2007
10,000 Square Feet Lot
$240,500 Zestimate®
$179/sqft
$-- HOA
Overview
- 61 days
- 10
- 0
Facts & features
Interior
Bedrooms & bathrooms
- Bedrooms: 3
- Bathrooms: 2
- Full bathrooms: 2
Heating
- Forced air, Propane / Butane
Cooling
- Refrigerator
Appliances
- Included: Dishwasher, Garbage disposal, Microwave, Range / Oven, Refrigerator
Features
- Flooring: Carpet, Concrete
- Has fireplace: Yes
Interior area
- Total interior livable area: 1,340 sqft
Property
Parking
- Parking features: Garage - Attached
Features
- Has view: Yes
- View description: Territorial, Mountain
Lot
- Size: 10,000 Square Feet
Details
- Parcel number: 21326306
Construction
Type & style
- Home type: SingleFamily
Materials
- wood frame
Condition
- Year built: 2007
Community & HOA
Location
- Region: California City
Financial & listing details
- Price per square foot: $179/sqft
- Tax assessed value: $70,552
Foreclosure details
Estimated market value
$240,500
$207,000 - $267,000
$1,870/mo
Price history
| Date | Event | Price |
|---|---|---|
| 4/15/2011 | Sold | $88,000-5.4%$66/sqft |
Source: Public Record Report a problem | ||
| 8/24/2009 | Sold | $93,000+9.4%$69/sqft |
Source: Public Record Report a problem | ||
| 5/9/2008 | Listing removed | $85,000$63/sqft |
Source: Century 21 Report a problem | ||
| 4/5/2008 | Listed for sale | $85,000-2.3%$63/sqft |
Source: Century 21 Report a problem | ||
| 3/10/2008 | Sold | $87,032+222.3%$65/sqft |
Source: Public Record Report a problem | ||
| 4/27/2006 | Sold | $27,000+863.9%$20/sqft |
Source: Public Record Report a problem | ||
| 4/5/2005 | Sold | $2,801$2/sqft |
Source: Public Record Report a problem | ||
Public tax history
| Year | Property taxes | Tax assessment |
|---|---|---|
| 2026 | -- | $70,552 +2% |
| 2025 | $937 -4% | $69,169 +2% |
| 2024 | $976 -1.1% | $67,814 +2% |
| 2023 | $986 +2.1% | $66,485 +2% |
| 2022 | $966 | $65,182 +2% |
| 2021 | -- | $63,905 +1% |
| 2020 | $902 -0.9% | $63,251 |
| 2019 | $910 +1% | $63,251 +4% |
| 2018 | $901 -0.5% | $60,797 +2% |
| 2017 | $905 +7.4% | $59,606 +2% |
| 2016 | $843 -0.2% | $58,438 +1.5% |
| 2015 | $844 +2.8% | $57,562 +2% |
| 2014 | $821 | $56,435 +5.3% |
| 2013 | -- | $53,600 -2.7% |
| 2012 | $869 +1.3% | $55,080 -8.7% |
| 2011 | $858 +0.2% | $60,300 |
| 2010 | $857 -30.1% | $60,300 -28.7% |
| 2009 | $1,226 +37.2% | $84,600 +40.7% |
| 2008 | $894 +76% | $60,127 +104.8% |
| 2007 | $508 +214.7% | $29,360 +859.5% |
| 2006 | $161 +4.1% | $3,060 +21.8% |
| 2005 | $155 -0.1% | $2,512 |
| 2004 | $155 -0.1% | $2,512 +1.9% |
| 2003 | $155 | $2,466 +4% |
| 2002 | $155 +23.9% | $2,371 +2% |
| 2001 | $125 | $2,325 |
| 2000 | -- | $2,325 |
Find assessor info on the county website
Monthly payment
Climate risks
Neighborhood: 93505


Similar homes
- $235,0003 bd2 ba1.1k sqft21148 Bancroft Ct, California City, CA 93505For Sale
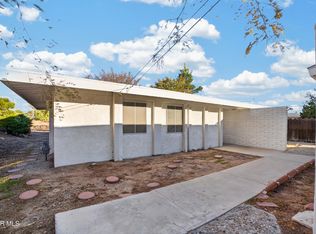 MLS ID #26008556, Brandon Ilic. GAVAR
- $239,9993 bd2 ba1.4k sqft21021 Lodi Pl, California City, CA 93505For Sale
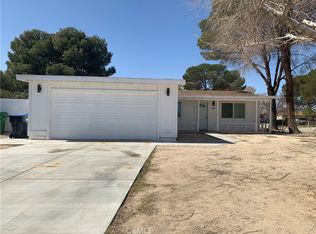 MLS ID #SR26242926, Vahe Patatanyan, CA Real Estate Group. CRMLS
- $249,0003 bd2 ba1.5k sqft7606 Jimson Ave, California City, CA 93505For Sale
 MLS ID #26005074, Maritza Arellano. GAVAR
- $--3 bd2 ba1.6k sqft20624 92nd St, California City, CA 93505Auction
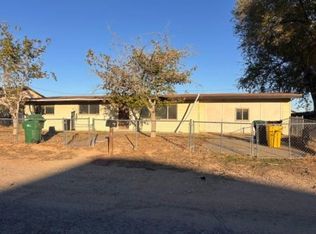 ServiceLink Auction
