This 1332 square foot single family home has 2 bedrooms and 1.0 bathrooms. This home is located at 22168 Peralta St, Hayward, CA 94541.
Pre-foreclosure
Street View
Est. $609,700
22168 Peralta St, Hayward, CA 94541
2beds
1baths
1,332sqft
SingleFamily
Built in 1918
7,492 Square Feet Lot
$609,700 Zestimate®
$458/sqft
$-- HOA
Overview
- 68 days
- 512
- 32
Facts & features
Interior
Bedrooms & bathrooms
- Bedrooms: 2
- Bathrooms: 1
Interior area
- Total interior livable area: 1,332 sqft
Property
Parking
- Parking features: Carport
Lot
- Size: 7,492 Square Feet
Details
- Parcel number: 4283620
Construction
Type & style
- Home type: SingleFamily
Materials
- wood frame
Condition
- Year built: 1918
Community & HOA
Location
- Region: Hayward
Financial & listing details
- Price per square foot: $458/sqft
- Tax assessed value: $355,020
Foreclosure details
Estimated market value
$609,700
$579,000 - $646,000
$2,830/mo
Price history
| Date | Event | Price |
|---|---|---|
| 4/27/2026 | Listing removed | $698,000$524/sqft |
Source:  Bay East AOR #41121706 Report a problem | ||
| 4/7/2026 | Pending sale | $698,000$524/sqft |
Source: Bay East AOR #41121706 Report a problem | ||
| 1/22/2026 | Listed for sale | $698,000-6.9%$524/sqft |
Source: Bay East AOR #41121706 Report a problem | ||
| 9/22/2023 | Sold | $750,000+346.4%$563/sqft |
Source: Public Record Report a problem | ||
| 6/18/2010 | Sold | $168,000-36.6%$126/sqft |
Source: Public Record Report a problem | ||
| 4/4/2008 | Sold | $265,000-31.5%$199/sqft |
Source: Bay East AOR #40294540 Report a problem | ||
| 6/6/2007 | Sold | $386,706-14.1%$290/sqft |
Source: Public Record Report a problem | ||
| 1/14/2005 | Sold | $450,000+119.5%$338/sqft |
Source: Bay East AOR #40051609 Report a problem | ||
| 1/27/2000 | Sold | $205,000$154/sqft |
Source: Bay East AOR #11035433 Report a problem | ||
Public tax history
| Year | Property taxes | Tax assessment |
|---|---|---|
| 2026 | -- | $355,020 +2% |
| 2025 | $4,378 -51.7% | $348,061 -53% |
| 2024 | $9,058 +112.1% | $740,000 +121.2% |
| 2023 | $4,271 +2% | $334,546 +2% |
| 2022 | $4,189 +0.8% | $327,987 +2% |
| 2021 | $4,154 +1.1% | $321,558 +1% |
| 2020 | $4,109 -0.7% | $318,262 +2% |
| 2019 | $4,139 +8.8% | $312,024 +2% |
| 2018 | $3,803 | $305,908 +2% |
| 2017 | $3,803 +6.3% | $299,911 +2% |
| 2016 | $3,577 +7.3% | $294,030 +1.5% |
| 2015 | $3,335 | $289,615 +2% |
| 2014 | $3,335 | $283,944 +0.5% |
| 2013 | -- | $282,662 +14.2% |
| 2012 | -- | $247,500 -4.8% |
| 2011 | -- | $260,000 |
| 2010 | -- | $260,000 +20.9% |
| 2009 | -- | $215,000 -45.5% |
| 2008 | -- | $394,434 -16.7% |
| 2007 | -- | $473,381 +2% |
| 2006 | -- | $464,100 +105.3% |
| 2005 | -- | $226,040 +2% |
| 2004 | -- | $221,609 +1.9% |
| 2003 | -- | $217,548 +2% |
| 2002 | -- | $213,282 +2% |
| 2001 | $2,253 | $209,100 |
Find assessor info on the county website
Monthly payment
Climate risks
Neighborhood: North Hayward


Similar homes
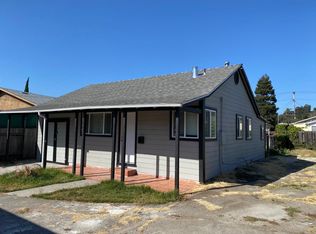
- $645,0003 bd2 ba1k sqft403 Smalley Ave, Hayward, CA 94541For Sale
 MLS ID #426133711, William J. Wu DRE #01410701, Golden Realty. SFAR
- $633,0003 bd3 ba1.3k sqft3127 Madsen St, Hayward, CA 94541For Sale
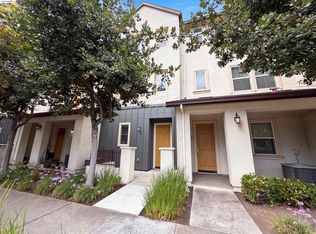 MLS ID #41144101, Lisa Soltesz. bridgeMLS/CCAR/Bay East AOR
- $682,8882 bd1 ba1.1k sqft1441 170th Ave, Hayward, CA 94541For Sale
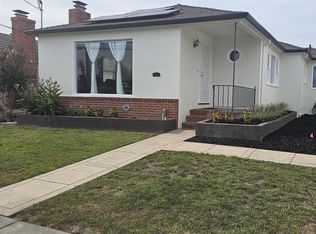 MLS ID #41150211, Dave Kelly. Bay East AOR
- $524,5003 bd2 ba1.3k sqftMesa Verde, Hayward, CA 94546For Sale
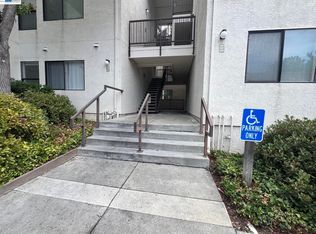 MLS ID #41146432, Jagrup Judge. Bay East AOR
