$--
-- bd|1 ba|1.3k sqft
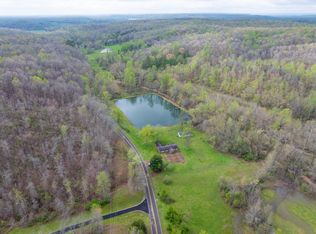
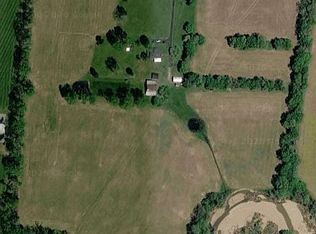
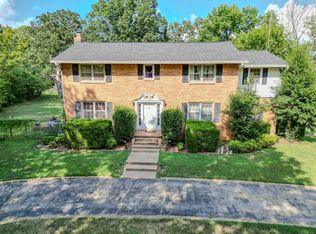
2240 Paint Rock Rd, Waverly, TN 37185
Off Market
Zillow last checked:
Listing updated:
June Twisdale 615-483-0944,
Parker Peery Properties 615-446-1884
Not available
Estimated sales range
Not available
Not available
| Date | Event | Price |
|---|---|---|
| 6/9/2026 | Pending sale | $999,000+426.1%$332/sqft |
Source: | ||
| 2/9/2026 | Sold | $189,875-19.7%$63/sqft |
Source: Public Record Report a problem | ||
| 10/3/2017 | Sold | $236,443-51.7%$78/sqft |
Source: Public Record Report a problem | ||
| 2/26/2015 | Listing removed | $489,500$162/sqft |
Source: Rushton & Co. #1609379 Report a problem | ||
| 2/14/2015 | Listed for sale | $489,500-30.1%$162/sqft |
Source: Rushton & Co. #1609379 Report a problem | ||
| 12/16/2011 | Sold | $700,000-53.3%$232/sqft |
Source: Public Record Report a problem | ||
| 10/3/2011 | Sold | $1,500,000-56.5%$498/sqft |
Source: Public Record Report a problem | ||
| 1/4/2011 | Listing removed | $3,452,000$1,146/sqft |
Source: Thomas Smith Properties #1163104 Report a problem | ||
| 8/12/2010 | Price change | $3,452,000-13.7%$1,146/sqft |
Source: Thomas Smith Properties #1163104 Report a problem | ||
| 3/14/2010 | Listed for sale | $4,000,000+222.6%$1,328/sqft |
Source: Thomas Smith Properties #1163104 Report a problem | ||
| 3/4/2005 | Sold | $1,240,000$412/sqft |
Source: Public Record Report a problem | ||
| Year | Property taxes | Tax assessment |
|---|---|---|
| 2025 | $1,485 | $80,700 |
| 2024 | $1,485 | $80,700 |
| 2023 | $1,485 +15.1% | $80,700 +36.4% |
| 2022 | $1,289 +0.8% | $59,150 +0.8% |
| 2021 | $1,280 | $58,700 |
| 2020 | $1,280 +27.7% | $58,700 +19.1% |
| 2019 | $1,002 | $49,300 |
| 2018 | $1,002 | $49,300 |
| 2017 | $1,002 -10.3% | $49,300 -2.9% |
| 2016 | $1,117 | $50,775 |
| 2015 | $1,117 +2.9% | $50,775 +2.9% |
| 2014 | $1,086 | $49,347 |
| 2013 | $1,086 | $49,347 |
| 2012 | $1,086 | $49,347 |
| 2011 | -- | $49,347 -66.9% |
| 2010 | -- | $149,219 +14.9% |
| 2009 | $2,376 +1.7% | $129,846 +1.7% |
| 2008 | $2,337 +3.5% | $127,710 +17.7% |
| 2007 | $2,257 | $108,520 |
| 2006 | $2,257 | $108,520 |
| 2005 | $2,257 -5.9% | $108,520 |
| 2003 | $2,398 +4.4% | $108,520 +4.4% |
| 2002 | $2,297 | $103,949 +0.5% |
| 2001 | -- | $103,383 -84.6% |
| 2000 | -- | $670,502 |
Find assessor info on the county website
Source: RealTracs MLS as distributed by MLS GRID. This data may not be complete. We recommend contacting the local school district to confirm school assignments for this home.
A local agent can set up tours, give advice and negotiate with sellers.