This beautiful Lely Golf Estates 3 BR + 2 BA home has been completely remodeled and has many extra features added. Huge kitchen with an island flows to the spacious living room and out to big lanai with an amazing, tranquil setting pool. Brand new kitchen cabinets, SS appliances, granite, wine cooler and plenty of cooking space for even the most demanding gourmet chef. Bamboo floor in the living room and state of the art bathrooms. Don't miss walking closet with build in cabinets. Extended patio with fresh herbs deck. That house is a Florida living at it is very best. There are many neighborhood facilities and Downtown Naples is just a 5 mile drive to delicious restaurants, gorgeous shops and multiple beaches. Enjoy an amazing lifestyle and come back to a dreams came true home.
Pre-foreclosure
Street View
Est. $542,100
225 Saint Andrews Blvd, Naples, FL 34113
4beds
1,741sqft
SingleFamily
Built in 1978
10,454 Square Feet Lot
$542,100 Zestimate®
$311/sqft
$7/mo HOA
Overview
- 65 days
- 40
- 0
Facts & features
Interior
Bedrooms & bathrooms
- Bedrooms: 4
- Bathrooms: 2
- Full bathrooms: 2
Appliances
- Included: Dishwasher, Garbage disposal, Microwave, Range / Oven, Refrigerator
Features
- Flooring: Tile
- Has fireplace: No
Interior area
- Total interior livable area: 1,741 sqft
Property
Parking
- Total spaces: 5
- Parking features: Garage - Attached
Features
- Exterior features: Stucco
- Has spa: Yes
Lot
- Size: 10,454 Square Feet
Details
- Parcel number: 55101440006
Construction
Type & style
- Home type: SingleFamily
Materials
- Roof: Asphalt
Condition
- Year built: 1978
Community & HOA
HOA
- Has HOA: Yes
- HOA fee: $7 monthly
Location
- Region: Naples
Financial & listing details
- Price per square foot: $311/sqft
- Tax assessed value: $465,574
- Annual tax amount: $2,790
Foreclosure details
Estimated market value
$542,100
$499,000 - $580,000
$3,553/mo
Price history
| Date | Event | Price |
|---|---|---|
| 7/29/2011 | Sold | $184,000-12.3%$106/sqft |
Source: Public Record Report a problem | ||
| 5/19/2011 | Price change | $209,900-8.3%$121/sqft |
Source: Royal Properties of Naples LLC #210040843 Report a problem | ||
| 2/6/2011 | Price change | $229,000-8%$132/sqft |
Source: Royal Properties of Naples LLC #210040843 Report a problem | ||
| 1/13/2011 | Price change | $249,000-6%$143/sqft |
Source: Royal Properties of Naples LLC #210040843 Report a problem | ||
| 12/12/2010 | Price change | $264,900+2.3%$152/sqft |
Source: Royal Properties of Naples LLC #210040843 Report a problem | ||
| 12/10/2010 | Listed for sale | $259,000+55.1%$149/sqft |
Source: Royal Properties of Naples LLC #210040843 Report a problem | ||
| 1/19/2010 | Sold | $167,000-27.4%$96/sqft |
Source: Public Record Report a problem | ||
| 8/20/2009 | Listing removed | $230,000$132/sqft |
Source: Taylor, Bean & Whitaker Report a problem | ||
| 4/9/2009 | Price change | $230,000-4.2%$132/sqft |
Source: Taylor, Bean & Whitaker Report a problem | ||
| 3/27/2009 | Listed for sale | $240,000$138/sqft |
Source: Taylor, Bean & Whitaker Report a problem | ||
Public tax history
| Year | Property taxes | Tax assessment |
|---|---|---|
| 2025 | $2,790 +6.3% | $242,580 +2.9% |
| 2024 | $2,624 +12.7% | $235,743 +3% |
| 2023 | $2,328 -1.5% | $228,877 +3% |
| 2022 | $2,364 -0.2% | $222,211 +3% |
| 2021 | $2,368 +2.3% | $215,739 +1.4% |
| 2020 | $2,314 +9.5% | $212,760 +8.1% |
| 2019 | $2,114 +2.5% | $196,785 +1.9% |
| 2018 | $2,062 -9.4% | $193,116 +2.1% |
| 2017 | $2,275 +2% | $189,144 +2.1% |
| 2016 | $2,231 +2.8% | $185,254 +0.7% |
| 2015 | $2,171 -0.5% | $183,966 +38.8% |
| 2014 | $2,182 +10.7% | $132,506 +2.1% |
| 2013 | $1,972 +1.3% | $129,809 +2.4% |
| 2012 | $1,946 -28.7% | $126,803 -34.2% |
| 2011 | $2,729 -15.2% | $192,589 +3.4% |
| 2010 | $3,219 -12% | $186,327 -19.2% |
| 2009 | $3,660 | $230,571 -19% |
| 2008 | $3,660 +32.1% | $284,686 +28.9% |
| 2007 | $2,770 -1.6% | $220,884 +2.5% |
| 2006 | $2,816 | $215,497 +3% |
| 2005 | $2,816 +2.5% | $209,220 +17.5% |
| 2004 | $2,748 +81.4% | $178,036 +47% |
| 2003 | $1,515 +1.8% | $121,078 +2.4% |
| 2002 | $1,489 -49.9% | $118,240 +1.6% |
| 2001 | $2,973 +110.7% | $116,378 |
| 2000 | $1,411 | -- |
Find assessor info on the county website
Monthly payment
Climate risks
Neighborhood: Lely


Similar homes
- $539,0003 bd2 ba2k sqft391 Torrey Pines Point, Naples, FL 34113For Sale
 MLS ID #2261450, Katherine Dennis, John R. Wood Properties. Marco Multi List
- $499,0003 bd2 ba1.8k sqft223 Pine Valley CIR, NAPLES, FL 34113For Sale
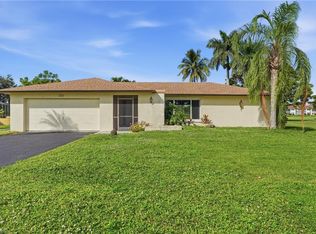
 MLS ID #226026694, Cathy Libecci, Coldwell Banker Realty. SWFLMLS
- $485,0003 bd2 ba1.7k sqft225 Pebble Beach CIR, NAPLES, FL 34113For Sale
 MLS ID #226013471, Ryan Nordyke, John R Wood Properties. SWFLMLS
- $565,0002 bd2 ba1.9k sqft302 Bay Meadows DR, NAPLES, FL 34113For Sale
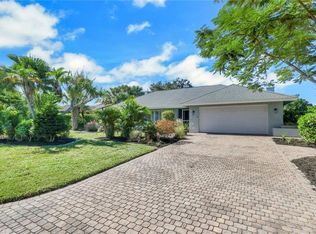 MLS ID #226039618, Sharon Cowie, Realty One Group MVP. SWFLMLS
- $548,0003 bd2 ba1.6k sqft641 Saint Andrews BLVD #108-1, NAPLES, FL 34113For SaleMLS ID #226036446, James Kux, Downing Frye Realty Inc.. SWFLMLS
- $450,0004 bd2 ba1.3k sqft5230 Warren ST, NAPLES, FL 34113For SaleMLS ID #226034766, Sandra Romero Garcia, Mato Realty, LLC. SWFLMLS
- $599,9002 bd2 ba1.7k sqft212 Forest Hills BLVD, NAPLES, FL 34113For SaleMLS ID #226033558, Jenna Richardson, Premier Sotheby's Int'l Realty. SWFLMLS
- $614,9003 bd2 ba2k sqft201 Palmetto Dunes CIR, NAPLES, FL 34113For SaleMLS ID #226032208, Lorna Bird, Keller Williams Realty Naples. SWFLMLS
- $599,9003 bd2 ba1.4k sqft5232 Raintree LN, NAPLES, FL 34113For SaleMLS ID #226019950, Doreen Vachon, Downing Frye Realty Inc.. SWFLMLS
- $650,0003 bd2 ba1.9k sqft5272 Myrtle LN, NAPLES, FL 34113For SaleMLS ID #226034997, Laura Dier, Realty One Group MVP. SWFLMLS
- $455,0003 bd2 ba1.2k sqft439 Saint Andrews BLVD #145-0, NAPLES, FL 34113For SaleMLS ID #226031969, Gerardo Ballivian, Coldwell Banker Realty. SWFLMLS
- $650,0003 bd2 ba1.7k sqft427 Torrey Pines PT, NAPLES, FL 34113For SaleMLS ID #224037668, Lisa Morton, Premiere Plus Realty Company. SWFLMLS
- $493,0003 bd2 ba1.2k sqft657 Saint Andrews BLVD, NAPLES, FL 34113For SaleMLS ID #226021315, Todd Zuk, Coldwell Banker Realty. SWFLMLS
- $409,9003 bd2 ba1.5k sqft430 Saint Andrews BLVD #6, NAPLES, FL 34113For SaleMLS ID #226033441, Diana Villarreal, Xclusive Homes LLC. SWFLMLS
- $574,9003 bd2 ba1.5k sqft5854 Westbourgh CT, NAPLES, FL 34112For SaleMLS ID #226032569, John Krol, Realty World Top Producers Rlt. SWFLMLS
- $690,0003 bd2 ba2k sqft350 Pinehurst CIR, NAPLES, FL 34113For SaleMLS ID #226029322, Jared Blocker, Premiere Plus Realty Company. SWFLMLS
- $499,9004 bd2 ba1.2k sqft5317 Fleming ST, NAPLES, FL 34113For SaleMLS ID #226035653, Mercy Uribe, eXp Realty LLC. SWFLMLS
- $690,0003 bd2 ba1.7k sqft102 Muirfield CIR, NAPLES, FL 34113For SaleMLS ID #226024005, Deliga Boitel, Mato Realty, LLC. SWFLMLS
- $435,0003 bd2 ba1.3k sqft5341 Martin ST, NAPLES, FL 34113For SaleMLS ID #226031239, Steven Koleno, Beycome of Florida LLC. SWFLMLS
