Turnkey investment opportunity. Fully leased commercial building at 2334 E York Street with established tenants and consistent rental income. Above commercial space, two additional levels of residential or commercial use. Positioned in a high-demand East Kensington/York corridor with strong foot traffic and long-term growth potential.
For sale
Price cut: $35.5K (10/12)
$550,000
2334 E York St, Philadelphia, PA 19125
3beds
700sqft
Townhouse
Built in 1875
1,143 Square Feet Lot
$-- Zestimate®
$786/sqft
$-- HOA
What's special
- 53 days
- 90
- 6
Zillow last checked:
Listing updated:
Listed by:
Ledion Zurbo 267-515-9401,
Homestarr Realty 2153555565
Source: Bright MLS,MLS#: PAPH2674044
Facts & features
Interior
Bedrooms & bathrooms
- Bedrooms: 3
- Bathrooms: 2
- Full bathrooms: 2
- Main level bathrooms: 2
- Main level bedrooms: 3
Heating
- Forced Air, Natural Gas
Cooling
- Ceiling Fan(s), Central Air, Electric
Appliances
- Included: Electric Water Heater
Features
- Basement: Connecting Stairway
- Has fireplace: No
Interior area
- Total structure area: 700
- Total interior livable area: 700 sqft
- Finished area above ground: 700
Property
Parking
- Parking features: On Street
- Has uncovered spaces: Yes
Accessibility
- Accessibility features: Doors - Swing In
Features
- Levels: Three
- Stories: 3
- Pool features: None
Lot
- Size: 1,143 Square Feet
- Dimensions: 18.00 x 63.00
Details
- Additional structures: Above Grade
- Parcel number: 882005160
- Zoning: CMX2
- Special conditions: Standard
Construction
Type & style
- Home type: Townhouse
- Architectural style: Other
- Property subtype: Townhouse
Materials
- Masonry
- Foundation: Stone
Condition
- New construction: No
- Year built: 1875
Utilities & green energy
- Sewer: Public Sewer
- Water: Public
Community & HOA
Community
- Subdivision: Fishtown
HOA
- Has HOA: No
Location
- Region: Philadelphia
- Municipality: PHILADELPHIA
Financial & listing details
- Price per square foot: $786/sqft
- Tax assessed value: $405,000
- Annual tax amount: $5,669
- Date on market: 9/24/2026
- Listing agreement: Exclusive Right To Sell
- Ownership: Fee Simple
Estimated market value
Not available
Estimated sales range
Not available
$2,224/mo
Price history
| Date | Event | Price |
|---|---|---|
| 10/12/2026 | Price change | $550,000-6.1%$786/sqft |
Source:  Bright MLS #PAPH2674044 Report a problem | ||
| 9/24/2026 | Listed for sale | $585,500+54.1%$836/sqft |
Source: Bright MLS #PAPH2674044 Report a problem | ||
| 10/8/2025 | Listing removed | $2,300$3/sqft |
Source: Zillow Rentals Report a problem | ||
| 9/9/2025 | Listed for rent | $2,300+15%$3/sqft |
Source: Zillow Rentals Report a problem | ||
| 6/6/2025 | Sold | $380,000-11.6%$543/sqft |
Source: Public Record Report a problem | ||
| 12/12/2024 | Listing removed | $429,997-4.4%$614/sqft |
Source: Bright MLS #PAPH2424740 Report a problem | ||
| 12/4/2024 | Listed for sale | $449,997-7.6%$643/sqft |
Source: Bright MLS #PAPH2424740 Report a problem | ||
| 11/5/2022 | Listing removed | -- |
Source:  Coldwell Banker Hearthside Report a problem | ||
| 9/8/2022 | Price change | $487,000-7.7%$696/sqft |
Source: Coldwell Banker Hearthside #PAPH2041982 Report a problem | ||
| 7/2/2022 | Price change | $527,900-1.9%$754/sqft |
Source: Coldwell Banker Hearthside #PAPH2041982 Report a problem | ||
| 5/13/2022 | Price change | $537,900-1.3%$768/sqft |
Source: Coldwell Banker Hearthside #PAPH2041982 Report a problem | ||
| 1/29/2022 | Price change | $544,900-0.9%$778/sqft |
Source: Coldwell Banker Hearthside #PAPH2041982 Report a problem | ||
| 11/3/2021 | Listed for sale | $549,900+466.9%$786/sqft |
Source: Coldwell Banker Hearthside #PAPH2041982 Report a problem | ||
| 3/24/2021 | Listing removed | -- |
Source: Owner Report a problem | ||
| 11/16/2020 | Listing removed | $2,000$3/sqft |
Source: Owner Report a problem | ||
| 9/18/2020 | Listed for rent | $2,000$3/sqft |
Source: Owner Report a problem | ||
| 2/23/2009 | Sold | $97,000$139/sqft |
Source: Public Record Report a problem | ||
Public tax history
| Year | Property taxes | Tax assessment |
|---|---|---|
| 2025 | $5,669 +0% | $405,000 +0% |
| 2024 | $5,666 | $404,800 |
| 2023 | $5,666 +106.3% | $404,800 |
| 2022 | $2,746 | -- |
| 2021 | $2,746 +0.7% | -- |
| 2018 | $2,727 | -- |
| 2017 | $2,727 -0.2% | -- |
| 2016 | $2,732 +11.2% | -- |
| 2015 | $2,458 | -- |
| 2014 | $2,458 +4.5% | $175,600 +1114% |
| 2012 | $2,353 | $14,464 |
| 2011 | -- | $14,464 |
| 2010 | -- | $14,464 |
| 2009 | -- | $14,464 |
| 2008 | -- | $14,464 |
| 2007 | -- | $14,464 +7.6% |
| 2006 | -- | $13,440 |
| 2005 | -- | $13,440 |
| 2004 | -- | $13,440 +9.9% |
| 2003 | -- | $12,224 +18.6% |
| 2002 | -- | $10,304 +7.7% |
| 2000 | -- | $9,568 +12.8% |
| 1999 | -- | $8,480 |
Find assessor info on the county website
Monthly payment
Est. payment
Payment breakdown
Explore the cost of this home by adjusting the details. Changes won't be saved.Climate risks
Neighborhood: Fishtown
Nearby schools
Similar homes
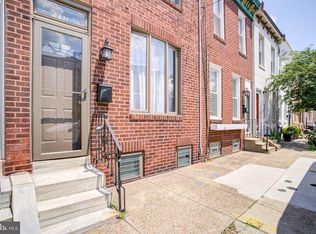
- $315,0003 bd2 ba1k sqft2331 E Hazzard St, Philadelphia, PA 19125For Sale
 MLS ID #PAPH2678706, Christopher Somers, KW Empower. Bright MLS
- $369,0003 bd2 ba990 sqft1502 E Berks St, Philadelphia, PA 19125For Sale
 MLS ID #PAPH2651588, Arthur Dolan, Dolan Family Real Estate. Bright MLS
- $299,0003 bd2 ba880 sqft2302 E Albert St, Philadelphia, PA 19125For Sale
 MLS ID #PAPH2656818, Joseph Rey, RE/MAX One Realty. Bright MLS
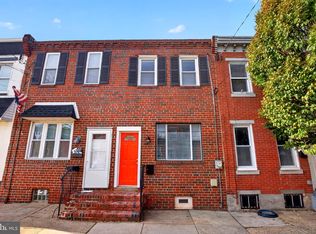
- $275,0002 bd2 ba856 sqft2324 Almond St, Philadelphia, PA 19125For Sale
 MLS ID #PAPH2676650, Kyle McShane, Coldwell Banker Realty. Bright MLS
- $580,0003 bd2 ba960 sqft202 N Clifton St, Philadelphia, PA 19107For SaleMLS ID #PAPH2681534, Matthew Marino, Real of Pennsylvania. Bright MLS
- $295,9002 bd1 ba900 sqft2208 Gaul St, Philadelphia, PA 19125For SaleMLS ID #PAPH2606802, Brian McCloud, RE/MAX Access. Bright MLS
- $450,0003 bd1 ba810 sqft110 Pollard St, Philadelphia, PA 19123For SaleMLS ID #PAPH2655240, Raymond Tran, Philadelphia Homes. Bright MLS
- $474,9003 bd2 ba906 sqftVictory Building, Philadelphia, PA 19107For SaleMLS ID #PAPH2679772, Carrie Zhao, GE21 Realty. Bright MLS
- $285,0004 bd2 ba984 sqft2259 E William St, Philadelphia, PA 19134For SaleMLS ID #PAPH2686232, Mr. Miguel Rivera, Century 21 Advantage Gold-Castor. Bright MLS
- $550,0003 bd3 ba900 sqft932-34 N 19th St, Philadelphia, PA 19130For SaleMLS ID #PAPH2618332, Jim Roche, KW Empower. Bright MLS
- $279,0002 bd1 ba764 sqft1507 N Bodine St, Philadelphia, PA 19122For SaleMLS ID #PAPH2665224, David cohen, Compass RE. Bright MLS
- $429,0003 bd2 ba1k sqft865 N Bambrey St, Philadelphia, PA 19130For SaleMLS ID #PAPH2622436, Xin Devine, Capital Realty Services LLC. Bright MLS
- $385,0003 bd1 ba975 sqft439 W George St, Philadelphia, PA 19123For SaleMLS ID #PAPH2651776, Dylan Dello Buono, EXIT Elevate Realty. Bright MLS
- $290,5002 bd2 ba886 sqft1440 N Orkney 0 St #1, Philadelphia, PA 19122New ConstructionMLS ID #PAPH2682690, Jaqi Kleiman, Delphi Property Group, LLC. Bright MLS
- $329,9002 bd2 ba744 sqft2216 Titan St, Philadelphia, PA 19146For SaleMLS ID #PAPH2688520, Joseph Cristinzio, Mercury Real Estate Group. Bright MLS
- $369,9002 bd2 ba800 sqft418 Sigel St, Philadelphia, PA 19148For SaleMLS ID #PAPH2680718, Tang Vu, Elfant Wissahickon-Rittenhouse Square. Bright MLS
- $319,9003 bd1 ba1k sqft418 Emily St, Philadelphia, PA 19148For SaleMLS ID #PAPH2682168, Steven Osiecki, RE/MAX Access. Bright MLS
- $275,0003 bd2 ba1k sqft3205 Pearl St, Philadelphia, PA 19104For SaleMLS ID #PAPH2607264, Allen Lin, Realty Mark Associates. Bright MLS
- $290,0003 bd2 ba960 sqft2704 S Marshall St, Philadelphia, PA 19148For SaleMLS ID #PAPH2686092, Taison DeVore, Trinity Property Advisors. Bright MLS
- $354,5003 bd2 ba998 sqft912 N 30th St, Philadelphia, PA 19130For SaleMLS ID #PAPH2616674, Scott Mendelsohn, HG Realty Services, Ltd.. Bright MLS
