It's a pleasure to present a fully renovated three bedroom two bathroom pool and spa home with outdoor shower on lushly landscaped grounds. 16' hedge surrounds this very private, spa-like home with entertainment seating around a wood-burning fire pit, multiple raised-bed gardens, new roof, new smooth-coat stucco, new windows and doors, and architectural planters accenting the pool, raised spa, and front of home. The reclaimed wood master bath boasts two sinks and a dual head glass shower overlooking the pool. Bring your swimsuits, summer awaits!
Pre-foreclosure
Est. $809,100
2350 N Los Alamos Rd, Palm Springs, CA 92262
3beds
1,248sqft
SingleFamily
Built in 1977
10,018 Square Feet Lot
$809,100 Zestimate®
$648/sqft
$-- HOA
Overview
- 72 days
- 80
- 2
Facts & features
Interior
Bedrooms & bathrooms
- Bedrooms: 3
- Bathrooms: 2
- Full bathrooms: 2
Heating
- Other
Cooling
- Central
Appliances
- Included: Dishwasher, Dryer, Freezer, Garbage disposal, Microwave, Refrigerator, Washer
- Laundry: Garage
Features
- Bar
- Flooring: Hardwood
- Has fireplace: Yes
Interior area
- Total interior livable area: 1,248 sqft
Property
Parking
- Parking features: Garage - Attached
Features
- Levels: Ground Level
- Exterior features: Cement / Concrete
- Has spa: Yes
- Has view: Yes
- View description: Mountain
Lot
- Size: 10,018 Square Feet
Details
- Parcel number: 501422002
Construction
Type & style
- Home type: SingleFamily
Materials
- wood frame
- Roof: Composition
Condition
- Year built: 1977
Community & HOA
Location
- Region: Palm Springs
Financial & listing details
- Price per square foot: $648/sqft
- Tax assessed value: $271,380
Foreclosure details
Estimated market value
$809,100
$769,000 - $850,000
$4,516/mo
Price history
| Date | Event | Price |
|---|---|---|
| 10/13/2026 | Listing removed | $850,000$681/sqft |
Source:  CLAW #26869469 Report a problem | ||
| 8/6/2026 | Listed for sale | $850,000+41.9%$681/sqft |
Source: CLAW #26869469 Report a problem | ||
| 6/23/2018 | Listing removed | $599,000$480/sqft |
Source: Marcus John Miceli #18343566 Report a problem | ||
| 6/22/2018 | Price change | $599,000-1%$480/sqft |
Source: Marcus John Miceli #18343566 Report a problem | ||
| 6/13/2018 | Price change | $605,000-0.7%$485/sqft |
Source: Marcus John Miceli #18343566 Report a problem | ||
| 6/3/2018 | Price change | $609,000-2.6%$488/sqft |
Source: Marcus John Miceli #18343566 Report a problem | ||
| 5/13/2018 | Listed for sale | $625,000+363%$501/sqft |
Source: Marcus John Miceli #18343566 Report a problem | ||
| 12/7/2016 | Sold | $135,000+12.5%$108/sqft |
Source: Public Record Report a problem | ||
| 2/15/2012 | Sold | $120,000-7.6%$96/sqft |
Source:  CDAR/ Desert Area MLS #21440355 Report a problem | ||
| 12/7/2011 | Price change | $129,900-7.1%$104/sqft |
Source: The Duncan Group #21440355 Report a problem | ||
| 11/2/2011 | Listed for sale | $139,900+29.9%$112/sqft |
Source: The Duncan Group #21440355 Report a problem | ||
| 6/23/2011 | Sold | $107,709+23.1%$86/sqft |
Source: Public Record Report a problem | ||
| 12/28/1999 | Sold | $87,500+0.9%$70/sqft |
Source: Public Record Report a problem | ||
| 7/8/1999 | Sold | $86,704$69/sqft |
Source: Public Record Report a problem | ||
Public tax history
| Year | Property taxes | Tax assessment |
|---|---|---|
| 2026 | -- | $271,380 +2% |
| 2025 | $3,354 -2.5% | $266,059 +2% |
| 2024 | $3,439 -1.8% | $260,843 +2% |
| 2023 | $3,500 -0.1% | $255,729 +2% |
| 2022 | $3,504 +1.9% | $250,716 +1.9% |
| 2021 | $3,439 +4.5% | $245,974 +1% |
| 2020 | $3,292 | $243,453 +2% |
| 2019 | -- | $238,680 +2% |
| 2018 | $3,180 +15% | $234,000 +17% |
| 2017 | $2,766 | $200,000 +57.1% |
| 2016 | $2,766 +57.8% | $127,319 +1.5% |
| 2015 | $1,753 +2.1% | $125,409 +2% |
| 2014 | $1,716 | $122,954 +0.5% |
| 2013 | -- | $122,400 +37.9% |
| 2012 | -- | $88,740 -17.2% |
| 2011 | -- | $107,238 +0.8% |
| 2010 | -- | $106,438 -0.2% |
| 2009 | -- | $106,693 +2% |
| 2008 | -- | $104,602 +2% |
| 2007 | -- | $102,552 +2% |
| 2006 | -- | $100,542 +2% |
| 2005 | -- | $98,571 +3.9% |
| 2003 | -- | $94,870 +2% |
| 2002 | -- | $93,010 +2% |
| 2001 | $1,169 +2.2% | $91,187 +2% |
| 2000 | $1,143 | $89,400 |
Find assessor info on the county website
Monthly payment
Climate risks
Neighborhood: Gene Autry
- $441,0004 bd2 ba1.5k sqft2341 N Whitewater Club Dr, Palm Springs, CA 92262Off Market

- $734,2004 bd2 ba1.5k sqft2390 N Los Alamos Rd, Palm Springs, CA 92262Off Market

- $481,4003 bd2 ba1.5k sqft2340 N Los Alamos Rd, Palm Springs, CA 92262Off Market
- $671,4004 bd2 ba1.5k sqft2311 N Whitewater Club Dr, Palm Springs, CA 92262Off Market

Similar homes
- $850,0003 bd2 ba1.7k sqft1980 N Los Alamos Rd, Palm Springs, CA 92262For Sale
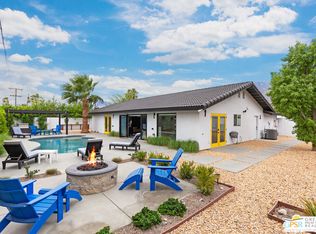 MLS ID #26999079PS, Jeff Blacker DRE # 01711459, Compass. CLAW
- $793,0003 bd2 ba1.5k sqft952 N Camino Condor, Palm Springs, CA 92262For Sale
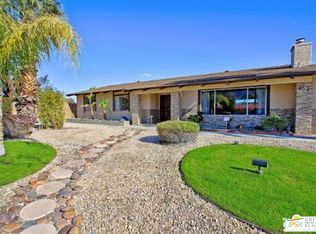 MLS ID #26876467PS, Kate Castle DRE # 01135296, Berkshire Hathaway HomeServices California Properties. CLAW
- $865,0003 bd2 ba1.4k sqft3095 N Chuperosa Rd, Palm Springs, CA 92262For Sale
 MLS ID #219154068PS, Mark Gutkowski, Bennion Deville Homes. CRMLS
- $860,0003 bd2 ba1.3k sqft2200 N Carillo Rd, Palm Springs, CA 92262For Sale
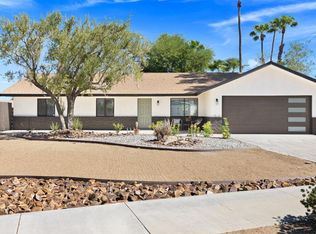 MLS ID #219153649DA, Daniel McCown, Fathom Realty Group Inc.. CRMLS
