Main-Floor Living with Primary En-Suite & Fenced Backyard! Enjoy the convenience of main-floor living in this home featuring an open-concept floor plan, spacious primary en-suite, and large deck overlooking a fenced backyard. Tenants currently in place, offering an opportunity for investors seeking an income-producing property. Don't miss this opportunity!
Active
$449,900
2416 N Mackenzie Dr, Post Falls, ID 83854
3beds
2baths
1,156sqft
Single Family Residence
Built in 2004
8,712 Square Feet Lot
$-- Zestimate®
$389/sqft
$-- HOA
What's special
Open-concept floor planMain-floor livingFenced backyardSpacious primary en-suite
- 52 days
- 408
- 38
Zillow last checked:
Listing updated:
Listed by:
Lenae Thornton 509-209-0741,
Keller Williams Spokane
Source: Coeur d'Alene MLS,MLS#: 26-9472
Facts & features
Interior
Bedrooms & bathrooms
- Bedrooms: 3
- Bathrooms: 2
- Main level bathrooms: 2
- Main level bedrooms: 3
Heating
- Natural Gas, Electric, Forced Air, Furnace
Appliances
- Included: Electric Range, Refrigerator, Disposal, Dishwasher
Features
- Flooring: Carpet, LVP
- Basement: None
- Common walls with other units/homes: No Common Walls
Interior area
- Total structure area: 1,156
- Total interior livable area: 1,156 sqft
Property
Parking
- Parking features: Garage - Attached
- Has attached garage: Yes
Features
- Exterior features: Lawn
- Fencing: Back Yard
- Has view: Yes
- View description: City
Lot
- Size: 8,712 Square Feet
- Features: Level
Details
- Parcel number: P24620010060
- Zoning: RES
Construction
Type & style
- Home type: SingleFamily
- Property subtype: Single Family Residence
Materials
- Vinyl Siding, Frame
- Foundation: Concrete Perimeter
- Roof: Composition
Condition
- Year built: 2004
Utilities & green energy
- Sewer: Public Sewer
- Water: Public
Community & HOA
Community
- Subdivision: Fieldstone
HOA
- Has HOA: Yes
- HOA name: Fieldstone Assoc
Location
- Region: Post Falls
Financial & listing details
- Price per square foot: $389/sqft
- Tax assessed value: $374,980
- Annual tax amount: $1,901
- Date on market: 9/17/2026
- Road surface type: Paved
Estimated market value
Not available
Estimated sales range
Not available
Not available
Price history
| Date | Event | Price |
|---|---|---|
| 9/17/2026 | Listed for sale | $449,900+2.3%$389/sqft |
Source:  Coeur d'Alene MLS #26-9472 Report a problem | ||
| 11/1/2025 | Listing removed | $439,893$381/sqft |
Source: Coeur d'Alene MLS #25-3414 Report a problem | ||
| 9/16/2025 | Price change | $439,8930%$381/sqft |
Source: Coeur d'Alene MLS #25-3414 Report a problem | ||
| 8/27/2025 | Price change | $439,8940%$381/sqft |
Source: Coeur d'Alene MLS #25-3414 Report a problem | ||
| 8/12/2025 | Price change | $439,8960%$381/sqft |
Source: Coeur d'Alene MLS #25-3414 Report a problem | ||
| 7/22/2025 | Price change | $439,8970%$381/sqft |
Source: Coeur d'Alene MLS #25-3414 Report a problem | ||
| 7/16/2025 | Price change | $439,8980%$381/sqft |
Source: Coeur d'Alene MLS #25-3414 Report a problem | ||
| 5/28/2025 | Price change | $439,8990%$381/sqft |
Source: Coeur d'Alene MLS #25-3414 Report a problem | ||
| 5/15/2025 | Price change | $439,900-2.2%$381/sqft |
Source: Coeur d'Alene MLS #25-3414 Report a problem | ||
| 4/14/2025 | Listed for sale | $449,900-6.3%$389/sqft |
Source: Coeur d'Alene MLS #25-3414 Report a problem | ||
| 12/4/2024 | Listing removed | $479,898$415/sqft |
Source: Coeur d'Alene MLS #24-8857 Report a problem | ||
| 11/13/2024 | Price change | $479,8980%$415/sqft |
Source: Coeur d'Alene MLS #24-8857 Report a problem | ||
| 11/11/2024 | Listing removed | $1,995-4.8%$2/sqft |
Source: Zillow Rentals Report a problem | ||
| 11/6/2024 | Price change | $479,8990%$415/sqft |
Source: Coeur d'Alene MLS #24-8857 Report a problem | ||
| 10/10/2024 | Listed for rent | $2,095$2/sqft |
Source: Zillow Rentals Report a problem | ||
| 10/1/2024 | Price change | $479,900-4%$415/sqft |
Source: Coeur d'Alene MLS #24-8857 Report a problem | ||
| 9/6/2024 | Listed for sale | $499,900+4.2%$432/sqft |
Source: Coeur d'Alene MLS #24-8857 Report a problem | ||
| 7/1/2024 | Listing removed | -- |
Source: Coeur d'Alene MLS #24-318 Report a problem | ||
| 1/11/2024 | Listed for sale | $479,900$415/sqft |
Source: Coeur d'Alene MLS #24-318 Report a problem | ||
| 1/1/2024 | Listing removed | -- |
Source: Coeur d'Alene MLS #23-394 Report a problem | ||
| 6/28/2023 | Listing removed | $479,900$415/sqft |
Source: Coeur d'Alene MLS #23-394 Report a problem | ||
| 1/18/2023 | Listed for sale | $479,900$415/sqft |
Source: Coeur d'Alene MLS #23-394 Report a problem | ||
| 1/1/2023 | Listing removed | -- |
Source: Coeur d'Alene MLS #22-7718 Report a problem | ||
| 9/14/2022 | Price change | $479,900-4%$415/sqft |
Source: Coeur d'Alene MLS #22-7718 Report a problem | ||
| 7/29/2022 | Listed for sale | $499,900$432/sqft |
Source: Coeur d'Alene MLS #22-7718 Report a problem | ||
Public tax history
| Year | Property taxes | Tax assessment |
|---|---|---|
| 2025 | $2,270 -5.7% | $374,980 -1.8% |
| 2024 | $2,406 +1.4% | $381,940 -6.5% |
| 2023 | $2,372 -11.2% | $408,336 -5.8% |
| 2022 | $2,672 -2.8% | $433,428 +57.3% |
| 2021 | $2,748 +1.3% | $275,600 +14.4% |
| 2020 | $2,712 +5.9% | $240,900 +12.3% |
| 2019 | $2,561 -5.6% | $214,550 +16.9% |
| 2018 | $2,712 +10.6% | $183,580 +14.1% |
| 2017 | $2,451 +101.2% | $160,860 +10.9% |
| 2016 | $1,218 +0.5% | $144,990 +2.1% |
| 2015 | $1,213 | $142,010 +19.7% |
| 2013 | $1,213 | $118,590 +3.4% |
| 2012 | -- | $114,660 -7.7% |
| 2011 | -- | $124,170 -5.1% |
| 2010 | -- | $130,810 |
Find assessor info on the county website
Monthly payment
Est. payment
Payment breakdown
Explore the cost of this home by adjusting the details. Changes won't be saved.Climate risks
Neighborhood: 83854
- $474,6004 bd3 ba1.8k sqft2394 N Mackenzie Dr, Post Falls, ID 83854Off Market

- $534,7004 bd3 ba2.4k sqft2438 N Mackenzie Dr, Post Falls, ID 83854Off Market
- $419,1003 bd2 ba1.1k sqft2369 N Cool Water Dr, Post Falls, ID 83854Off Market
- $553,1004 bd3 ba2k sqft2372 N Mackenzie Dr, Post Falls, ID 83854Off Market
Similar homes
- $440,0003 bd2 ba1.3k sqft1831 N Saint Helens Dr, Post Falls, ID 83854For Sale
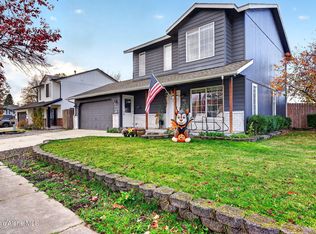 MLS ID #26-10656, Robert Quinton Quezada, eXp Realty. Coeur d'Alene MLS
- $449,0003 bd2 ba1.2k sqft2007 N Mackenzie Dr, Post Falls, ID 83854For Sale
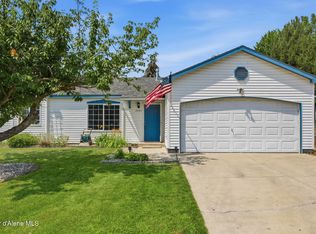 MLS ID #26-7604, Anthony Norris, Windermere/Coeur d'Alene Realty Inc. Coeur d'Alene MLS
- $445,0003 bd2 ba1.2k sqft2570 N Sparrow Loop, Post Falls, ID 83854For Sale
 MLS ID #26-7335, Jennifer Ivey, Tomlinson Sotheby's International Realty (Idaho). Coeur d'Alene MLS
- $490,0003 bd2 ba1.4k sqft1440 N Syringa St, Post Falls, ID 83854For Sale
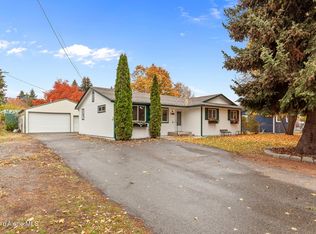 MLS ID #26-10616, Kim Boland, Legacy Land Group NW, LLC. Coeur d'Alene MLS
- $464,9003 bd2 ba1.5k sqft14364 N Cascade St, Rathdrum, ID 83858For Sale
 MLS ID #20262568, Logan Knight, RE/MAX CENTENNIAL. SELMLS
