Located in the established Highlands neighborhood, this 3-bedroom, 2-bath concrete block home features a comfortable living area, an attached one-car garage, and a paved driveway. The spacious yard offers room for gardening, outdoor seating, or weekend gatherings. Conveniently situated near shopping and dining along Dunn Avenue, with access to I-95 for travel throughout Jacksonville. An option for buyers seeking a primary residence or investment property. Sold as-is.
Active
$209,900
2463 GAYLAND Road, Jacksonville, FL 32218
3beds
1,392sqft
Single Family Residence
Built in 1958
10,454 Square Feet Lot
$205,500 Zestimate®
$151/sqft
$-- HOA
What's special
Attached one-car garageSpacious yardRoom for gardeningPaved driveway
- 11 days
- 223
- 16
Likely to sell faster than
Zillow last checked:
Listing updated:
Listed by:
ANTOINETTE JACKSON 904-401-7858,
FLORIDA HOMES REALTY & MORTGAGE PROPERTY MANAGEMENT 904-996-9115
Source: realMLS,MLS#: 2172341
Facts & features
Interior
Bedrooms & bathrooms
- Bedrooms: 3
- Bathrooms: 1
- Full bathrooms: 1
Heating
- Electric
Cooling
- Electric
Appliances
- Included: Electric Cooktop, Refrigerator
Features
- Flooring: Carpet, Tile
- Has fireplace: Yes
- Fireplace features: Wood Burning
Interior area
- Total interior livable area: 1,392 sqft
Property
Parking
- Total spaces: 1
- Parking features: Garage
- Garage spaces: 1
Features
- Levels: One
- Stories: 1
Lot
- Size: 10,454 Square Feet
Details
- Parcel number: 0422810000
Construction
Type & style
- Home type: SingleFamily
- Architectural style: Traditional
- Property subtype: Single Family Residence
Materials
- Block, Concrete
- Roof: Shingle
Condition
- New construction: No
- Year built: 1958
Utilities & green energy
- Sewer: Public Sewer
- Water: Public
- Utilities for property: Electricity Connected, Sewer Available, Water Available
Community & HOA
Community
- Subdivision: Highlands
HOA
- Has HOA: No
Location
- Region: Jacksonville
Financial & listing details
- Price per square foot: $151/sqft
- Tax assessed value: $153,431
- Annual tax amount: $3,083
- Date on market: 11/4/2026
- Listing terms: Cash,Conventional
Estimated market value
$205,500
$195,000 - $216,000
$1,390/mo
Price history
| Date | Event | Price |
|---|---|---|
| 11/5/2026 | Listed for sale | $209,900+517.4%$151/sqft |
Source:  realMLS #2172341 Report a problem | ||
| 8/21/2026 | Listing removed | $1,295$1/sqft |
Source: Zillow Rentals Report a problem | ||
| 8/13/2026 | Listed for rent | $1,295+26.3%$1/sqft |
Source: Zillow Rentals Report a problem | ||
| 5/11/2018 | Listing removed | $1,025$1/sqft |
Source: SunCoast Property Management, LLC Report a problem | ||
| 2/22/2018 | Listed for rent | $1,025+41.4%$1/sqft |
Source: SunCoast Property Management, LLC Report a problem | ||
| 4/8/2014 | Listing removed | $725$1/sqft |
Source: SAN MARCO REALTY #691628 Report a problem | ||
| 2/6/2014 | Price change | $725-7.6%$1/sqft |
Source: SAN MARCO REALTY #691628 Report a problem | ||
| 11/10/2013 | Listed for rent | $785+1.3%$1/sqft |
Source: SAN MARCO REALTY #691628 Report a problem | ||
| 2/15/2013 | Listing removed | $775$1/sqft |
Source: San Marco Realty #646374 Report a problem | ||
| 12/19/2012 | Price change | $775-2.5%$1/sqft |
Source: San Marco Realty #646374 Report a problem | ||
| 12/15/2012 | Listed for rent | $795$1/sqft |
Source: San Marco Realty #646374 Report a problem | ||
| 8/23/2012 | Sold | $34,000-13.9%$24/sqft |
Source: realMLS #615985 Report a problem | ||
| 4/4/2012 | Listing removed | $39,500$28/sqft |
Source: Watson Realty Corp #N615985 Report a problem | ||
| 3/30/2012 | Listed for sale | $39,500-70.7%$28/sqft |
Source: Watson Realty Corp #N615985 Report a problem | ||
| 1/7/2008 | Sold | $135,000+98.8%$97/sqft |
Source: Public Record Report a problem | ||
| 5/13/1999 | Sold | $67,900$49/sqft |
Source: Public Record Report a problem | ||
Public tax history
| Year | Property taxes | Tax assessment |
|---|---|---|
| 2025 | $3,083 +15.4% | $151,446 +10% |
| 2024 | $2,671 +15% | $137,679 +25.8% |
| 2023 | $2,323 +17.4% | $109,420 +10% |
| 2022 | $1,979 +10.3% | $99,473 +10% |
| 2021 | $1,794 +7.9% | $90,430 +9.7% |
| 2020 | $1,663 +4.9% | $82,408 +9.7% |
| 2019 | $1,586 +8% | $75,136 +10% |
| 2018 | $1,468 | $68,306 +1.9% |
| 2017 | $1,468 +6.7% | $67,014 +18.7% |
| 2016 | $1,376 +9.2% | $56,452 +12.4% |
| 2015 | $1,260 +8.5% | $50,231 +6.1% |
| 2014 | $1,161 | $47,333 -8.2% |
| 2013 | -- | $51,567 -5.9% |
| 2012 | -- | $54,803 -26.7% |
| 2011 | -- | $74,748 -22.9% |
| 2010 | -- | $96,911 -11.6% |
| 2009 | -- | $109,676 +51.7% |
| 2006 | -- | $72,286 +3% |
| 2005 | $839 | $70,181 +3% |
| 2004 | -- | $68,137 +1.9% |
| 2003 | $812 | $66,867 +2.4% |
| 2002 | -- | $65,300 +1.6% |
| 2001 | -- | $64,272 +3% |
| 2000 | -- | $62,400 +23.8% |
| 1999 | -- | $50,399 |
Find assessor info on the county website
Monthly payment
Est. payment
Payment breakdown
Explore the cost of this home by adjusting the details. Changes won't be saved.Climate risks
Neighborhood: Highlands


Similar homes
- $224,9003 bd2 ba1.2k sqft1533 KINGFISHER Lane N, Jacksonville, FL 32218For Sale
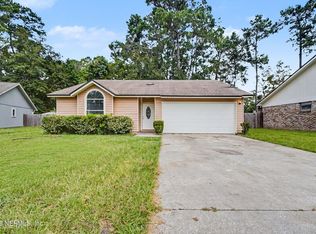 MLS ID #2164894, MATTHEW DEROCHER. realMLS
- $199,9004 bd3 ba1.1k sqft5911 JOHN F KENNEDY Drive N, Jacksonville, FL 32219For Sale
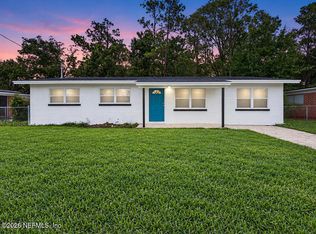 MLS ID #2172072, FRAZER FERNANDES. realMLS
- $199,9003 bd2 ba1.4k sqft9239 CASTLE Boulevard, Jacksonville, FL 32208For Sale
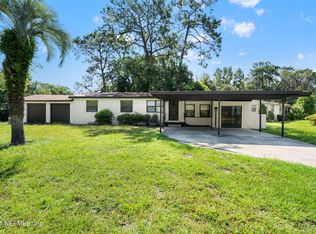 MLS ID #2161384, SINAI HALEY. realMLS
- $210,0003 bd1 ba1k sqft1728 LAYTON Road, Jacksonville, FL 32211For Sale
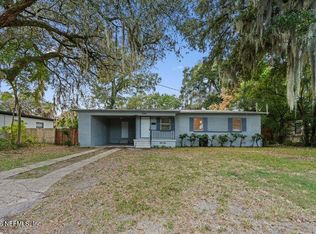 MLS ID #2172816, JOSHUA KEENAN. realMLS
