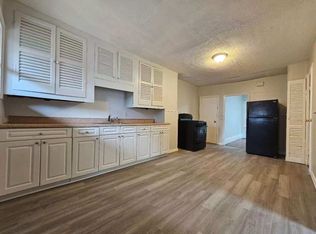
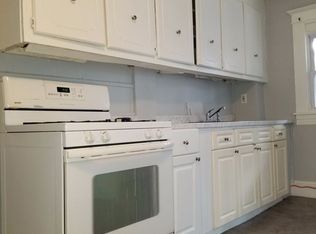
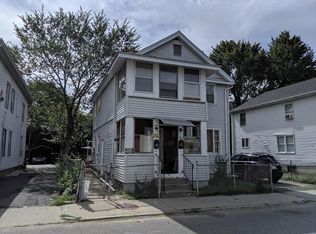
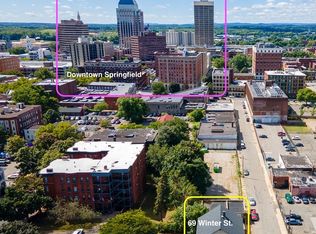
Great investment opportunity!! Nice 4 Family with great rents and plenty of updates! 1 unit was just turned over and now vacant, ready for a new Tenant or Owner. 3 units have lead certificates. All spacious 2 bedrooms units. Gas heating. Plenty of parking with a 3 car garage. Short distance to Interstate 91, Basketball Hall of Fame, The Mass Mutual Center, recent revitalized downtown area, new businesses and restaurants and blocks to MGM Grand Casino. First Open Houses 5/16 Saturday 1-3pm & 5/17, Sunday 12-2pm.
For sale
$569,900
27 Loring St, Springfield, MA 01105
8beds
5,880sqft
4 Family
Built in 1880
-- sqft lot
$567,900 Zestimate®
$97/sqft
$-- HOA
What's special
Gas heatingPlenty of parking
- 37 days |
- 407 |
- 31 |
Zillow last checked:
Listing updated:
Listed by:
Melinda Puzon 857-234-1080,
MP Signature Realty LLC 781-322-6928
Source: MLS PIN,MLS#: 73517329
Loading...
Facts & features
Interior
Bedrooms & bathrooms
- Bedrooms: 8
- Bathrooms: 4
- Full bathrooms: 4
Features
- Basement: Full
- Has fireplace: No
Interior area
- Total structure area: 5,880
- Total interior livable area: 5,880 sqft
- Finished area above ground: 5,880
Property
Parking
- Total spaces: 12
- Parking features: Off Street
- Garage spaces: 3
- Uncovered spaces: 9
Lot
- Size: 5,763 Square Feet
- Features: Level
Details
- Parcel number: 2592785
- Zoning: R3
Construction
Type & style
- Home type: MultiFamily
- Property subtype: 4 Family
Materials
- Foundation: Stone
- Roof: Shingle
Condition
- Year built: 1880
Utilities & green energy
- Electric: Circuit Breakers
- Sewer: Public Sewer
- Water: Public
Community & HOA
Location
- Region: Springfield
Financial & listing details
- Price per square foot: $97/sqft
- Tax assessed value: $379,800
- Annual tax amount: $5,955
- Date on market: 5/12/2026
- Exclusions: Tenants Personal Belongings.
- Total actual rent: 4135
Estimated market value
$567,900
$540,000 - $596,000
$1,518/mo
Price history
| Date | Event | Price |
|---|---|---|
| 5/13/2026 | Listed for sale | $569,900+272.5%$97/sqft |
Source: MLS PIN #73517329 Report a problem | ||
| 11/27/2018 | Sold | $153,000-14.5%$26/sqft |
Source: Public Record Report a problem | ||
| 7/10/2018 | Pending sale | $178,900$30/sqft |
Source: REAL LIVING REALTY PROFESSIONALS, LLC #72327246 Report a problem | ||
| 5/15/2018 | Listed for sale | $178,900+1331.2%$30/sqft |
Source: Real Living Realty Professionals, LLC #72327246 Report a problem | ||
| 10/23/2008 | Sold | $12,500-85.4%$2/sqft |
Source: Public Record Report a problem | ||
| 10/4/2006 | Sold | $85,672-4.8%$15/sqft |
Source: Public Record Report a problem | ||
| 1/24/1997 | Sold | $90,000+192.6%$15/sqft |
Source: Public Record Report a problem | ||
| 7/20/1995 | Sold | $30,760-74.1%$5/sqft |
Source: Public Record Report a problem | ||
| 9/1/1994 | Sold | $118,711$20/sqft |
Source: Public Record Report a problem | ||
Public tax history
| Year | Property taxes | Tax assessment |
|---|---|---|
| 2025 | $5,955 -1.1% | $379,800 +1.3% |
| 2024 | $6,023 +23.1% | $375,000 +30.7% |
| 2023 | $4,893 -3.2% | $287,000 +6.9% |
| 2022 | $5,053 +15.8% | $268,500 +16.3% |
| 2021 | $4,362 +12.6% | $230,800 +16.4% |
| 2020 | $3,873 +5.5% | $198,300 +6.3% |
| 2019 | $3,672 +5.8% | $186,600 +5.8% |
| 2018 | $3,470 +12.5% | $176,300 +12.4% |
| 2017 | $3,085 +6.5% | $156,900 +6.4% |
| 2016 | $2,898 +3.3% | $147,400 +3.4% |
| 2015 | $2,805 +13.1% | $142,600 +13.3% |
| 2014 | $2,481 +8.5% | $125,900 +8.5% |
| 2013 | $2,286 -0.6% | $116,000 |
| 2012 | $2,300 -4.5% | $116,000 -6.1% |
| 2011 | $2,409 -12% | $123,600 -12% |
| 2010 | $2,738 -7.3% | $140,400 -15% |
| 2009 | $2,955 -7% | $165,200 -16.6% |
| 2008 | $3,177 +4.7% | $198,200 +4.8% |
| 2007 | $3,035 +15.9% | $189,200 +22.9% |
| 2006 | $2,618 +16.7% | $154,000 +20.2% |
| 2005 | $2,243 +3.6% | $128,100 +12.4% |
| 2004 | $2,165 +50.6% | $114,000 +53.8% |
| 2003 | $1,438 +8.1% | $74,100 +10.8% |
| 2002 | $1,330 | $66,900 |
Find assessor info on the county website
Monthly payment
Est. payment$--/mo
Payment breakdown
Explore the cost of this home by adjusting the details. Changes won't be saved.All calculations are estimates and provided by Zillow, Inc. for informational purposes only. Actual amounts may vary.
HOA fees may include property taxes on listings classified as Co-Ops. Contact the listing agent and/or owner for fee details.
Mortgage interest rates are dependent on a number of factors, including credit score, down payment, and repayment length. Interest rate data provided by Zillow Group Marketplace, Inc. as of 1/1/1970 from various mortgage lenders with which we have lead or other similar arrangements; the Estimated Payment is an average of those rates.
See how much you could borrow to make a competitive offer.
Climate risks
Neighborhood: South End
Nearby schools
GreatSchools rating
- 7/10White Street SchoolGrades: PK-5Distance: 1.5 mi
- 3/10South End Middle SchoolGrades: 6-8Distance: 0.1 mi
- 2/10High School Of CommerceGrades: 9-12Distance: 0.8 mi
A local agent can set up tours, give advice and negotiate with sellers.


Nearby cities
Nearby neighborhoods
Nearby zip codes
Other Springfield Topics
