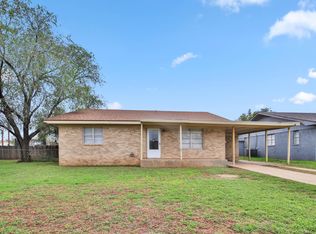
Great home with great location...park,YMCA,YMCA POOL, Minutes from Texas Tech and in an awesome school district this is a great starter home.
For sale by owner
$110,000
2721 63rd St, Lubbock, TX 79413
3beds
1,134sqft
SingleFamily
Built in 1958
6,950 Square Feet Lot
$-- Zestimate®
$97/sqft
$-- HOA
Overview
What the owner loves about this home
Huge backyard that has cement patio.....pergola is all its lacking.
- 8 days
- 246
- 12
Listed by:
Property Owner (806) 471-0616
Facts & features
Interior
Bedrooms & bathrooms
- Bedrooms: 3
- Bathrooms: 1
- Full bathrooms: 1
Heating
- Other
Features
- Has fireplace: No
Interior area
- Total interior livable area: 1,134 sqft
Property
Parking
- Parking features: Carport
Features
- Exterior features: Brick
Lot
- Size: 6,950 Square Feet
Details
- Parcel number: R86870
Construction
Type & style
- Home type: SingleFamily
Materials
- masonry
- Foundation: Slab
- Roof: Built-up
Condition
- New construction: No
- Year built: 1958
Community & HOA
Location
- Region: Lubbock
Financial & listing details
- Price per square foot: $97/sqft
- Tax assessed value: $120,553
- Date on market: 11/12/2026
Estimated market value
Not available
Estimated sales range
Not available
$1,167/mo
Price history
| Date | Event | Price |
|---|---|---|
| 11/12/2026 | Listed for sale | $110,000+22.2%$97/sqft |
Source: Owner Report a problem | ||
| 10/2/2026 | Listing removed | $90,000$79/sqft |
Source:  LBMLS #202610933 Report a problem | ||
| 9/7/2026 | Price change | $90,000-9.1%$79/sqft |
Source: LBMLS #202610933 Report a problem | ||
| 9/1/2026 | Listed for sale | $99,000$87/sqft |
Source: LBMLS #202610933 Report a problem | ||
| 8/8/2026 | Pending sale | $99,000$87/sqft |
Source: LBMLS #202610933 Report a problem | ||
| 8/5/2026 | Listed for sale | $99,000$87/sqft |
Source: LBMLS #202610933 Report a problem | ||
Public tax history
| Year | Property taxes | Tax assessment |
|---|---|---|
| 2026 | -- | $120,553 -2.2% |
| 2025 | $2,180 -3.3% | $123,217 -0.7% |
| 2024 | $2,254 +0.8% | $124,145 +3.2% |
| 2023 | $2,236 +534.3% | $120,282 +36% |
| 2022 | $352 +2.4% | $88,429 +10% |
| 2021 | $344 +1.2% | $80,390 +5.3% |
| 2020 | $340 0% | $76,376 +2% |
| 2019 | $340 +3.2% | $74,871 +7.5% |
| 2018 | $330 | $69,663 +10% |
| 2017 | $330 -35.2% | $63,330 |
| 2016 | $509 | $63,330 +14.1% |
| 2014 | $509 | $55,500 |
| 2013 | -- | $55,500 |
| 2012 | -- | $55,500 |
| 2011 | -- | $55,500 |
| 2010 | -- | $55,500 |
| 2009 | -- | $55,500 +2.9% |
| 2008 | -- | $53,912 +1.4% |
| 2007 | -- | $53,187 +10% |
| 2006 | -- | $48,352 +10% |
| 2005 | -- | $43,956 |
| 2004 | -- | $43,956 +3.6% |
| 2003 | -- | $42,443 +13.9% |
| 2002 | $466 -23% | $37,277 +9.1% |
| 2001 | $605 +11.4% | $34,170 |
| 2000 | $543 | $34,170 |
Find assessor info on the county website
Monthly payment
Est. payment
Payment breakdown
Explore the cost of this home by adjusting the details. Changes won't be saved.Climate risks
Neighborhood: Caprock
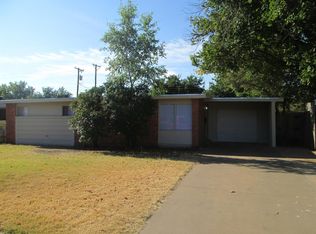


Similar homes
- $100,0003 bd2 ba1.3k sqft2313 47th St, Lubbock, TX 79412For Sale
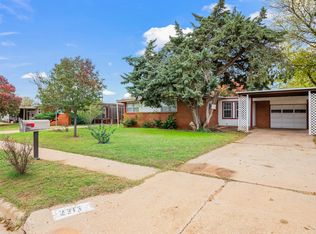 MLS ID #202615575, Josh Lashaway, Williams & Company Real Estate. LBMLS
- $112,0003 bd1 ba1k sqft2506 37th St, Lubbock, TX 79413For Sale
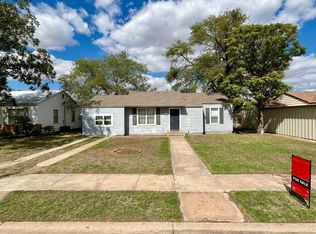 MLS ID #202612980, Chad Fortenberry, TechTown Realty. LBMLS
- $96,0003 bd1 ba1.3k sqft2611 43rd St, Lubbock, TX 79413For Sale
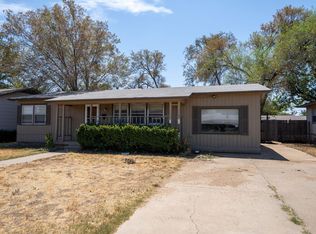 MLS ID #202613856, Jarrett Thornton, Jarrett Thornton. LBMLS
- $129,0003 bd2 ba1.3k sqft5005 39th St, Lubbock, TX 79414For Sale
 MLS ID #202615588, Michael Norsworthy, eXp Realty LLC. LBMLS
