Remodeled 2-family with views of the Thames River. Both units offer 3-bedrooms. Conveniently located on a bus route with easy access to the Subbase, Electric Boat, both casinos, I395 and Route 2. Easy walk to and from downtown Norwich. Great property for investors or owner occupants. Investors take note: Cap Rate is 10%
For sale
$298,900
277 Laurel Hill Avenue, Norwich, CT 06360
6beds
1,904sqft
Multi Family
Built in 1880
-- sqft lot
$-- Zestimate®
$157/sqft
$-- HOA
What's special
- 20 days
- 753
- 49
Zillow last checked:
Listing updated:
Listed by:
Ron Bates (860)447-8839,
Signature Properties of N.E. 860-447-8839
Source: Smart MLS,MLS#: 24123280
Facts & features
Interior
Bedrooms & bathrooms
- Bedrooms: 6
- Bathrooms: 2
- Full bathrooms: 2
Heating
- Forced Air, Natural Gas
Cooling
- None
Features
- Basement: Full
- Attic: Walk-up
- Has fireplace: No
Interior area
- Total structure area: 1,904
- Total interior livable area: 1,904 sqft
- Finished area above ground: 1,904
Property
Features
- Has view: Yes
- View description: Water
- Has water view: Yes
- Water view: Water
Lot
- Size: 7,840 Square Feet
- Features: Level, Sloped, Rolling Slope
Details
- Parcel number: 2029110
- Zoning: MF
Construction
Type & style
- Home type: MultiFamily
- Architectural style: Units on different Floors
- Property subtype: Multi Family
Materials
- Vinyl Siding
- Foundation: Masonry
- Roof: Shingle
Condition
- New construction: No
- Year built: 1880
Utilities & green energy
- Sewer: Public Sewer
- Water: Public
Community & HOA
Community
- Subdivision: Laurel Hill
HOA
- Has HOA: No
Location
- Region: Norwich
Financial & listing details
- Price per square foot: $157/sqft
- Tax assessed value: $135,500
- Annual tax amount: $4,627
- Date on market: 10/17/2026
Estimated market value
Not available
Estimated sales range
Not available
Not available
Price history
| Date | Event | Price |
|---|---|---|
| 10/19/2026 | Listed for sale | $298,900+99.3%$157/sqft |
Source:  Smart MLS #24123280 Report a problem | ||
| 6/2/2024 | Listing removed | -- |
Source: Smart MLS #24014379 Report a problem | ||
| 5/12/2024 | Listed for rent | $1,895$1/sqft |
Source: Smart MLS #24014379 Report a problem | ||
| 2/5/2024 | Sold | $150,000-25%$79/sqft |
Source: Smart MLS #170601282 Report a problem | ||
| 11/10/2023 | Pending sale | $200,000$105/sqft |
Source: Smart MLS #170601282 Report a problem | ||
| 9/29/2023 | Listed for sale | $200,000+61.3%$105/sqft |
Source: Smart MLS #170601282 Report a problem | ||
| 6/9/2023 | Sold | $124,000+195.2%$65/sqft |
Source: Public Record Report a problem | ||
| 7/9/1987 | Sold | $42,000$22/sqft |
Source: Public Record Report a problem | ||
Public tax history
| Year | Property taxes | Tax assessment |
|---|---|---|
| 2025 | $5,484 +6% | $135,500 |
| 2024 | $5,176 +26.4% | $135,500 +60.4% |
| 2023 | $4,094 -0.1% | $84,500 |
| 2022 | $4,097 -0.3% | $84,500 |
| 2021 | $4,110 +0.3% | $84,500 |
| 2020 | $4,096 +1% | $84,500 |
| 2019 | $4,055 +16.2% | $84,500 +17.2% |
| 2018 | $3,489 -0.7% | $72,100 |
| 2017 | $3,514 +1.4% | $72,100 |
| 2015 | $3,465 +4.6% | $72,100 |
| 2014 | $3,312 -17.2% | $72,100 -41.9% |
| 2013 | $4,001 +3.8% | $124,000 |
| 2012 | $3,856 +7.9% | $124,000 |
| 2011 | $3,575 +2.9% | $124,000 |
| 2010 | $3,474 +3.3% | $124,000 |
| 2009 | $3,362 +30.3% | $124,000 +42.5% |
| 2008 | $2,580 -11% | $87,000 |
| 2007 | $2,899 +4.1% | $87,000 |
| 2006 | $2,786 +4.1% | $87,000 |
| 2005 | $2,675 +83.6% | $87,000 +151.4% |
| 2003 | $1,457 +23.2% | $34,600 |
| 2001 | $1,183 | $34,600 |
Find assessor info on the county website
Monthly payment
Est. payment
Payment breakdown
Explore the cost of this home by adjusting the details. Changes won't be saved.Climate risks
Neighborhood: 06360
Nearby schools

Similar homes
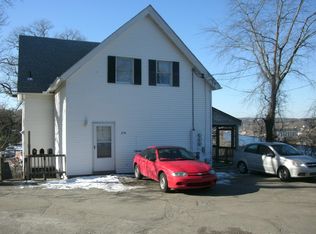
- $325,0004 bd3 ba1.8k sqft283 Laurel Hill Avenue, Norwich, CT 06360For Sale
 MLS ID #24213741, Gary Peacock, Berkshire Hathaway NE Prop.. Smart MLS
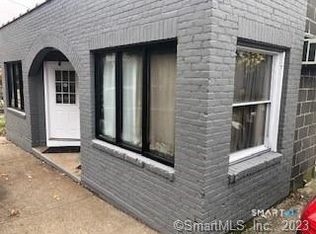
- $269,9004 bd3 ba1.6k sqft45 Baltic Street, Norwich, CT 06360For Sale
 MLS ID #24219321, Chris Maynard, William Raveis Real Estate. Smart MLS
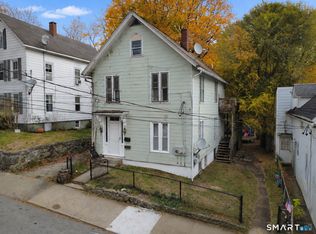
- $--3 bd2 ba1.4k sqft442 Laurel Hill Ave, Norwich, CT 06360Auction
 Auction.com 2
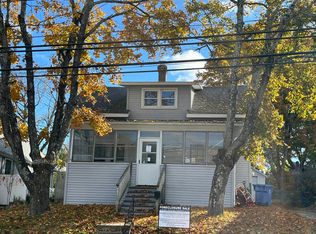
- $319,9005 bd3 ba2.6k sqft232 Franklin Street, Norwich, CT 06360For Sale
 MLS ID #24206430, Scott Aceto, Smith & Oak Real Estate Company. Smart MLS
- $300,0003 bd2 ba1.1k sqft480 New London Turnpike, Norwich, CT 06360For SaleMLS ID #24195401, Brian W. Connolly, Real Broker CT, LLC. Smart MLS
- $399,9005 bd2 ba2.2k sqft27 Lucas Park Road, Norwich, CT 06360For SaleMLS ID #24219432, Mario A. Stephens, RE/MAX Legends. Smart MLS
- $285,9003 bd1 ba1.4k sqft16 Will Road, Norwich, CT 06360For SaleMLS ID #24216614, Steph Rush, RE/MAX Legends. Smart MLS
- $279,9004 bd2 ba1.4k sqft50-52 Dunham Street, Norwich, CT 06360For SaleMLS ID #24194087, Daniel Hernandez, CLMA Realty. Smart MLS
- $249,9005 bd2 ba2.5k sqft617 East Main Street, Norwich, CT 06360For SaleMLS ID #24187014, Shay Hugo Vaezzadeh, Oxford Realty. Smart MLS
- $319,0005 bd3 ba2.5k sqft313 Central Avenue, Norwich, CT 06360For SaleMLS ID #24200773, Herb Carlon, Coldwell Banker Realty. Smart MLS
- $295,0009 bd3 ba2.4k sqft35 Lake Street, Norwich, CT 06360For SaleMLS ID #24201871, Steph Rush, RE/MAX Legends. Smart MLS
- $349,9003 bd2 ba1.4k sqft37 Reynolds Street, Norwich, CT 06360For SaleMLS ID #24217514, Jason Saphire, www.HomeZu.com. Smart MLS
- $310,0004 bd2 ba2.1k sqft329 Washington Street, Norwich, CT 06360For SaleMLS ID #24217093, Patrick Garrett, Exceptional Real Estate LLC. Smart MLS
- $339,0004 bd2 ba1.6k sqft34 Division Street, Norwich, CT 06360For SaleMLS ID #24217673, Ishanna Codd, RE/MAX One. Smart MLS
- $349,0004 bd2 ba1.5k sqft23 Bentley Avenue, Norwich, CT 06360For SaleMLS ID #24217152, Michelle Sireci, KEY Real Estate Services LLC. Smart MLS
- $359,5004 bd2 ba1.5k sqft89 Hickory Street, Norwich, CT 06360For SaleMLS ID #24218368, James Kelly, William Raveis Real Estate. Smart MLS
- $289,9253 bd3 ba2k sqft2 Mediterranean Lane, Norwich, CT 06360For SaleMLS ID #24215985, Maria Pirulli, Five Stars Realty. Smart MLS
- $365,0003 bd1 ba1.7k sqft17 Ridgewood Drive, Norwich, CT 06360For SaleMLS ID #24218233, Mary C. Nasi, IMT Realty. Smart MLS
- $315,0003 bd1 ba1.3k sqft170 Old Canterbury Turnpike, Norwich, CT 06360For SaleMLS ID #24218325, Tina Luft, Kazantzis Real Estate, LLC. Smart MLS
- $269,9003 bd2 ba1.6k sqft39 Geer Avenue, Norwich, CT 06360For SaleMLS ID #24209595, Bill Heenan, William Raveis Real Estate. Smart MLS
