Looking for an income producing property? Check out this 2 unit rental property featuring 2 separate units, each offering 1 bedroom and 1 bathroom. Whether you're looking to expand your investment portfolio or get started in real estate investing, this property is worth a look! Don't miss out on this opportunity.
Active
$85,000
2802 S Hackley St, Muncie, IN 47302
2beds
1baths
--sqft
Multi Family, Duplex
Built in 1900
-- sqft lot
$-- Zestimate®
$--/sqft
$-- HOA
What's special
- 50 days
- 107
- 10
Zillow last checked:
Listing updated:
Listed by:
Albert Stancato astancato@highgarden.com,
Highgarden Real Estate,
Kellie Ryan,
Highgarden Real Estate
Source: MIBOR as distributed by MLS GRID,MLS#: 22129382
Facts & features
Interior
Bedrooms & bathrooms
- Bedrooms: 2
- Bathrooms: 1
Features
- Has basement: Yes
Property
Parking
- Parking features: Carport
- Has carport: Yes
Lot
- Size: 6,534 Square Feet
Details
- Parcel number: 181122338002000003
Construction
Type & style
- Home type: MultiFamily
- Property subtype: Multi Family, Duplex
Condition
- New construction: No
- Year built: 1900
Community & HOA
Community
- Subdivision: 111 South Meridian Condominiums
Location
- Region: Muncie
Financial & listing details
- Tax assessed value: $71,800
- Annual tax amount: $1,554
- Date on market: 10/3/2026
- Cumulative days on market: 54 days
Estimated market value
Not available
Estimated sales range
Not available
$924/mo
Price history
| Date | Event | Price |
|---|---|---|
| 10/3/2026 | Listed for sale | $85,000-10.5% |
Source:  MIBOR as distributed by MLS GRID #22129382 Report a problem | ||
| 8/11/2026 | Listing removed | $95,000 |
Source: MIBOR as distributed by MLS GRID #22106580 Report a problem | ||
| 6/6/2026 | Listed for sale | $95,000+427.8% |
Source: MIBOR as distributed by MLS GRID #22106580 Report a problem | ||
| 2/12/2020 | Sold | $18,000-33.1% |
Source: MIBOR as distributed by MLS GRID #21686122 Report a problem | ||
| 1/31/2020 | Pending sale | $26,900 |
Source: RE/MAX Real Estate Groups #201952582 Report a problem | ||
| 10/11/2019 | Price change | $26,900-15.7% |
Source: RE/MAX Real Estate Groups #201923700 Report a problem | ||
| 8/19/2019 | Price change | $31,900-3% |
Source: RE/MAX Real Estate Groups #201923700 Report a problem | ||
| 6/10/2019 | Listed for sale | $32,900-55.6% |
Source: RE/MAX Real Estate Groups #201923700 Report a problem | ||
| 4/6/2019 | Listing removed | $525 |
Source: Zillow Rental Manager Report a problem | ||
| 4/3/2019 | Listed for rent | $525 |
Source: Zillow Rental Manager Report a problem | ||
| 1/23/2014 | Sold | $74,128 |
Source: Public Record Report a problem | ||
Public tax history
| Year | Property taxes | Tax assessment |
|---|---|---|
| 2025 | $1,154 +0.9% | $71,800 +24.4% |
| 2024 | $1,144 +6.1% | $57,700 +0.9% |
| 2023 | $1,078 +19% | $57,200 +6.1% |
| 2022 | $906 +19.8% | $53,900 +19% |
| 2021 | $756 -5.3% | $45,300 +19.8% |
| 2020 | $798 +0.2% | $37,800 -5.3% |
| 2019 | $796 -10.4% | $39,900 +0.3% |
| 2018 | $888 -1.1% | $39,800 +2.1% |
| 2017 | $898 +123.4% | $39,000 |
| 2016 | $402 -16.9% | $39,000 +1.6% |
| 2014 | $484 -38.2% | $38,400 +0.8% |
| 2013 | $784 +1.8% | $38,100 -1% |
| 2012 | $770 +10.9% | $38,500 +11% |
| 2011 | $694 -31.8% | $34,700 -31.8% |
| 2010 | $1,018 -4.7% | $50,900 -4.7% |
| 2009 | $1,068 | $53,400 |
Find assessor info on the county website
Monthly payment
Est. payment
Payment breakdown
Explore the cost of this home by adjusting the details. Changes won't be saved.Climate risks
Neighborhood: Southside


Similar homes
- $89,9003 bd2 ba1.9k sqft908 S Blaine St, Muncie, IN 47302Active
 MLS ID #22129302, Albert Stancato, Highgarden Real Estate. MIBOR as distributed by MLS GRID
- $79,9002 bd1 ba825 sqft3204 S Vine St, Muncie, IN 47302Active
 MLS ID #22129309, Albert Stancato, Highgarden Real Estate. MIBOR as distributed by MLS GRID
- $80,0002 bd1 ba884 sqft2309 S Mulberry St, Muncie, IN 47302For Sale
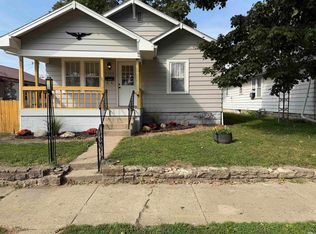 MLS ID #202640970, Annette Caldwell, RE/MAX Real Estate Groups. IRMLS
- $92,9002 bd1 ba725 sqft2012 S Pershing Dr, Muncie, IN 47302For Sale
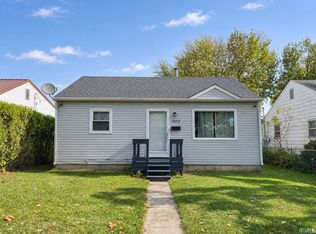 MLS ID #202646123, James Meredith, NextHome Elite Real Estate. IRMLS
