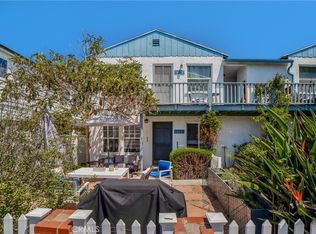
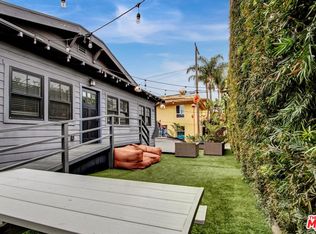
Charming, well-maintained 4-unit property on the highly sought after Venice Canals! The property sits on two lots giving it expansive canal frontage. Each unit features 2 beds, 1 bath; hardwood floors throughout, canal views, shared front yard space as well as shared rear enclosed patio area. Coin-op laundry on the property shared with all 4 units. 6-car uncovered parking + 3-single car garage parking totaling 9 spaces. This property is under LA RSO/LA City Rent Control. Centrally located to all shops & restaurants on Washington Square, Abbot Kinney, Venice Beach, etc. Rare opportunity to own a great income property on the famous Venice Canals!
For sale
$3,250,000
2824 Grand Canal, Venice, CA 90291
8beds
4baths
2,982sqft
Multi Family
Built in 1948
-- sqft lot
$3,106,400 Zestimate®
$1,090/sqft
$-- HOA
What's special
- 45 days
- 210
- 13
Zillow last checked:
Listing updated:
Listed by:
Kacey Barnett DRE # 01959770 949-606-3675,
Sail Realty 310-821-7245
Source: CLAW,MLS#: 26991989
Facts & features
Interior
Bedrooms & bathrooms
- Bedrooms: 8
- Bathrooms: 4
Heating
- Wall
Cooling
- None
Appliances
- Included: Dishwasher, Disposal, Range/Oven, Refrigerator
Interior area
- Total structure area: 2,982
- Total interior livable area: 2,982 sqft
Property
Parking
- Total spaces: 9
- Parking features: Open, Garage, Assigned
- Garage spaces: 3
- Uncovered spaces: 6
Features
- Levels: Two
- Stories: 2
Lot
- Size: 5,614 Square Feet
Details
- Additional structures: None
- Parcel number: 4227019020
- Zoning: LARW1
- Special conditions: Standard
Construction
Type & style
- Home type: MultiFamily
- Property subtype: Multi Family
Condition
- Year built: 1948
Community & HOA
Location
- Region: Venice
Financial & listing details
- Price per square foot: $1,090/sqft
- Tax assessed value: $1,535,463
- Date on market: 9/23/2026
Estimated market value
$3,106,400
$2.95M - $3.26M
Not available
Price history
| Date | Event | Price |
|---|---|---|
| 9/23/2026 | Listed for sale | $3,250,000+218.9%$1,090/sqft |
Source:  CLAW #26991989 Report a problem | ||
| 8/28/2024 | Listing removed | $4,200$1/sqft |
Source: Zillow Rentals Report a problem | ||
| 8/27/2024 | Listed for rent | $4,200+10.5%$1/sqft |
Source: Zillow Rentals Report a problem | ||
| 11/20/2020 | Listing removed | $3,800$1/sqft |
Source: Sail Realty Report a problem | ||
| 10/27/2020 | Price change | $3,800-3.8%$1/sqft |
Source: Sail Realty Report a problem | ||
| 9/17/2020 | Listed for rent | $3,950$1/sqft |
Source: Sail Realty Report a problem | ||
| 9/1/2019 | Listing removed | $3,950$1/sqft |
Source: Sail Realty Report a problem | ||
| 7/9/2019 | Listed for rent | $3,950+2.6%$1/sqft |
Source: Sail Realty Report a problem | ||
| 4/4/2019 | Listing removed | $3,850$1/sqft |
Source: Sail Realty Report a problem | ||
| 3/27/2019 | Price change | $3,850-3.8%$1/sqft |
Source: Sail Realty Report a problem | ||
| 2/6/2019 | Listed for rent | $4,000+9.6%$1/sqft |
Source: Sail Realty Report a problem | ||
| 6/20/2017 | Listing removed | $3,650$1/sqft |
Source: Sail Realty Report a problem | ||
| 6/1/2017 | Listed for rent | $3,650+14.1%$1/sqft |
Source: Zillow Rental Manager Report a problem | ||
| 10/23/2014 | Listing removed | $3,200$1/sqft |
Source: Sail Realty Report a problem | ||
| 10/2/2014 | Listed for rent | $3,200$1/sqft |
Source: Sail Realty Report a problem | ||
| 6/4/2014 | Listing removed | $3,200$1/sqft |
Source: Sail Realty Report a problem | ||
| 5/15/2014 | Listed for rent | $3,200$1/sqft |
Source: Sail Realty Report a problem | ||
| 10/13/2000 | Sold | $1,019,000$342/sqft |
Source: Public Record Report a problem | ||
Public tax history
| Year | Property taxes | Tax assessment |
|---|---|---|
| 2026 | -- | $1,566,171 +2% |
| 2025 | $18,718 +1.2% | $1,535,463 +2% |
| 2024 | $18,500 +2% | $1,505,357 +2% |
| 2023 | $18,145 +4.9% | $1,475,841 +2% |
| 2022 | $17,306 +1.3% | $1,446,904 +2% |
| 2021 | $17,087 -1% | $1,418,534 +1% |
| 2020 | $17,262 | $1,403,990 +2% |
| 2019 | $17,262 +4.8% | $1,376,461 +2% |
| 2018 | $16,470 | $1,349,472 +2% |
| 2017 | $16,470 +2.2% | $1,323,012 +2% |
| 2016 | $16,114 +2.3% | $1,297,071 +1.5% |
| 2015 | $15,744 +1% | $1,277,589 +2% |
| 2014 | $15,582 | $1,252,563 +2.5% |
| 2012 | -- | $1,222,455 +2% |
| 2011 | -- | $1,198,486 +0.8% |
| 2010 | -- | $1,189,530 -0.2% |
| 2009 | -- | $1,192,357 +2% |
| 2008 | -- | $1,168,978 +2% |
| 2007 | -- | $1,146,058 +2% |
| 2006 | -- | $1,123,587 |
| 2005 | -- | $1,123,587 +4% |
| 2004 | -- | $1,079,959 +1.9% |
| 2003 | -- | $1,060,167 +2% |
| 2002 | -- | $1,039,380 +195.2% |
| 2000 | -- | $352,044 |
Find assessor info on the county website
Monthly payment
Est. payment
Payment breakdown
Explore the cost of this home by adjusting the details. Changes won't be saved.Climate risks
Neighborhood: Venice


Similar homes
- $3,349,9998 bd4 ba2.9k sqft2722 Grand Canal, Venice, CA 90291For Sale
 MLS ID #SR26169780, David Walsh, Keller Williams VIP Properties. CRMLS
- $2,895,0008 bd4 ba3.3k sqft414 Grand Blvd, Venice, CA 90291For Sale
 MLS ID #P1-28865, Henrik Sarkisian, Pacific Horizon Bancorp. CRMLS
- $3,125,0007 bd5 ba2.6k sqft32 N Venice Blvd, Venice, CA 90291For Sale
 MLS ID #26748257, Drew Glickman DRE # 01493846, eXp Realty of Greater Los Angeles. CLAW
- $2,999,9997 bd6 ba2.6k sqft605 Indiana Ave, Venice, CA 90291For Sale
 MLS ID #26103478, Karsten Demers DRE # 01962663, Coldwell Banker Realty. CLAW
