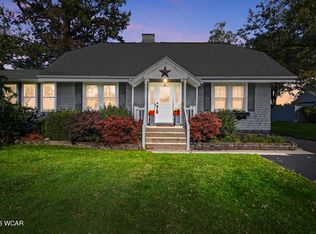
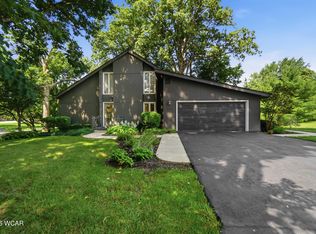
$283,200
3 bd2 ba2.2k sqft
2819 Shadowood Dr, Lima, OH 45805
Off Market
Likely to sell faster than
Zillow last checked:
Listing updated:
Gillian Cox 206-718-2088,
Berkshire Hathaway Professional Realty

$324,300
$308,000 - $341,000
$2,400/mo
| Date | Event | Price |
|---|---|---|
| 10/6/2026 | Pending sale | $329,900$133/sqft |
Source:  WCAR OH #311697 Report a problem | ||
| 9/22/2026 | Listed for sale | $329,900+95.8%$133/sqft |
Source: WCAR OH #311697 Report a problem | ||
| 3/24/2021 | Listing removed | -- |
Source: Owner Report a problem | ||
| 11/4/2020 | Sold | $168,500$68/sqft |
Source: Public Record Report a problem | ||
| 8/17/2020 | Pending sale | $168,500$68/sqft |
Source: Owner Report a problem | ||
| 8/8/2020 | Listed for sale | $168,500$68/sqft |
Source: Owner Report a problem | ||
| 6/24/2020 | Listing removed | $168,500$68/sqft |
Source: Owner Report a problem | ||
| 6/21/2020 | Listed for sale | $168,500+22.1%$68/sqft |
Source: Owner Report a problem | ||
| 3/31/2017 | Sold | $138,000-3.4%$56/sqft |
Source: Public Record Report a problem | ||
| 2/23/2015 | Listing removed | $142,900$58/sqft |
Source: Hartsock Realty LLC #362732 Report a problem | ||
| 1/27/2015 | Price change | $142,900-1.4%$58/sqft |
Source: Hartsock Realty LLC #362732 Report a problem | ||
| 12/18/2014 | Price change | $144,900-3.3%$58/sqft |
Source: Hartsock Realty LLC #362732 Report a problem | ||
| 11/5/2014 | Listed for sale | $149,900+0.3%$60/sqft |
Source: Hartsock Realty Report a problem | ||
| 8/30/2010 | Sold | $149,400-9.4%$60/sqft |
Source: Public Record Report a problem | ||
| 4/11/2010 | Listed for sale | $164,900+3.1%$67/sqft |
Source: Coldwell Banker Plus One #317494 Report a problem | ||
| 7/31/2008 | Sold | $159,900+15.9%$65/sqft |
Source: Public Record Report a problem | ||
| 4/17/2006 | Sold | $138,000$56/sqft |
Source: Public Record Report a problem | ||
| Year | Property taxes | Tax assessment |
|---|---|---|
| 2025 | $2,788 +0.1% | $69,650 |
| 2024 | $2,785 +2.6% | $69,650 +13% |
| 2023 | $2,715 -0.8% | $61,640 |
| 2022 | $2,738 -0.6% | $61,640 |
| 2021 | $2,754 +27.7% | $61,640 +20.9% |
| 2020 | $2,156 +0.4% | $51,000 |
| 2019 | $2,147 +0.4% | $51,000 |
| 2018 | $2,139 -2.1% | $51,000 |
| 2017 | $2,185 +1% | $51,000 |
| 2016 | $2,164 +0.1% | $51,000 |
| 2015 | $2,161 -0.3% | $51,000 +0.8% |
| 2014 | $2,169 +2.2% | $50,620 |
| 2013 | $2,121 +2.2% | $50,620 |
| 2012 | $2,074 -5.3% | $50,620 -7% |
| 2011 | $2,190 +0.8% | $54,430 |
| 2010 | $2,173 +3.8% | $54,430 |
| 2009 | $2,094 -8.2% | $54,430 -7.9% |
| 2008 | $2,281 +3.3% | $59,090 |
| 2007 | $2,209 -21.6% | $59,090 +0% |
| 2006 | $2,818 +9.2% | $59,080 +10% |
| 2005 | $2,581 -3.8% | $53,690 |
| 2004 | $2,683 +10.6% | $53,690 |
| 2003 | $2,427 +12.1% | $53,690 +14.1% |
| 2002 | $2,166 +2.2% | $47,075 |
| 2001 | $2,119 -1.7% | $47,075 |
| 2000 | $2,156 | $47,075 |
| 1999 | $2,156 | $47,075 |
A local agent can set up tours, give advice and negotiate with sellers.
A local lender can help you make sure your offer is ready when you are.